Round Trip Time Calculator
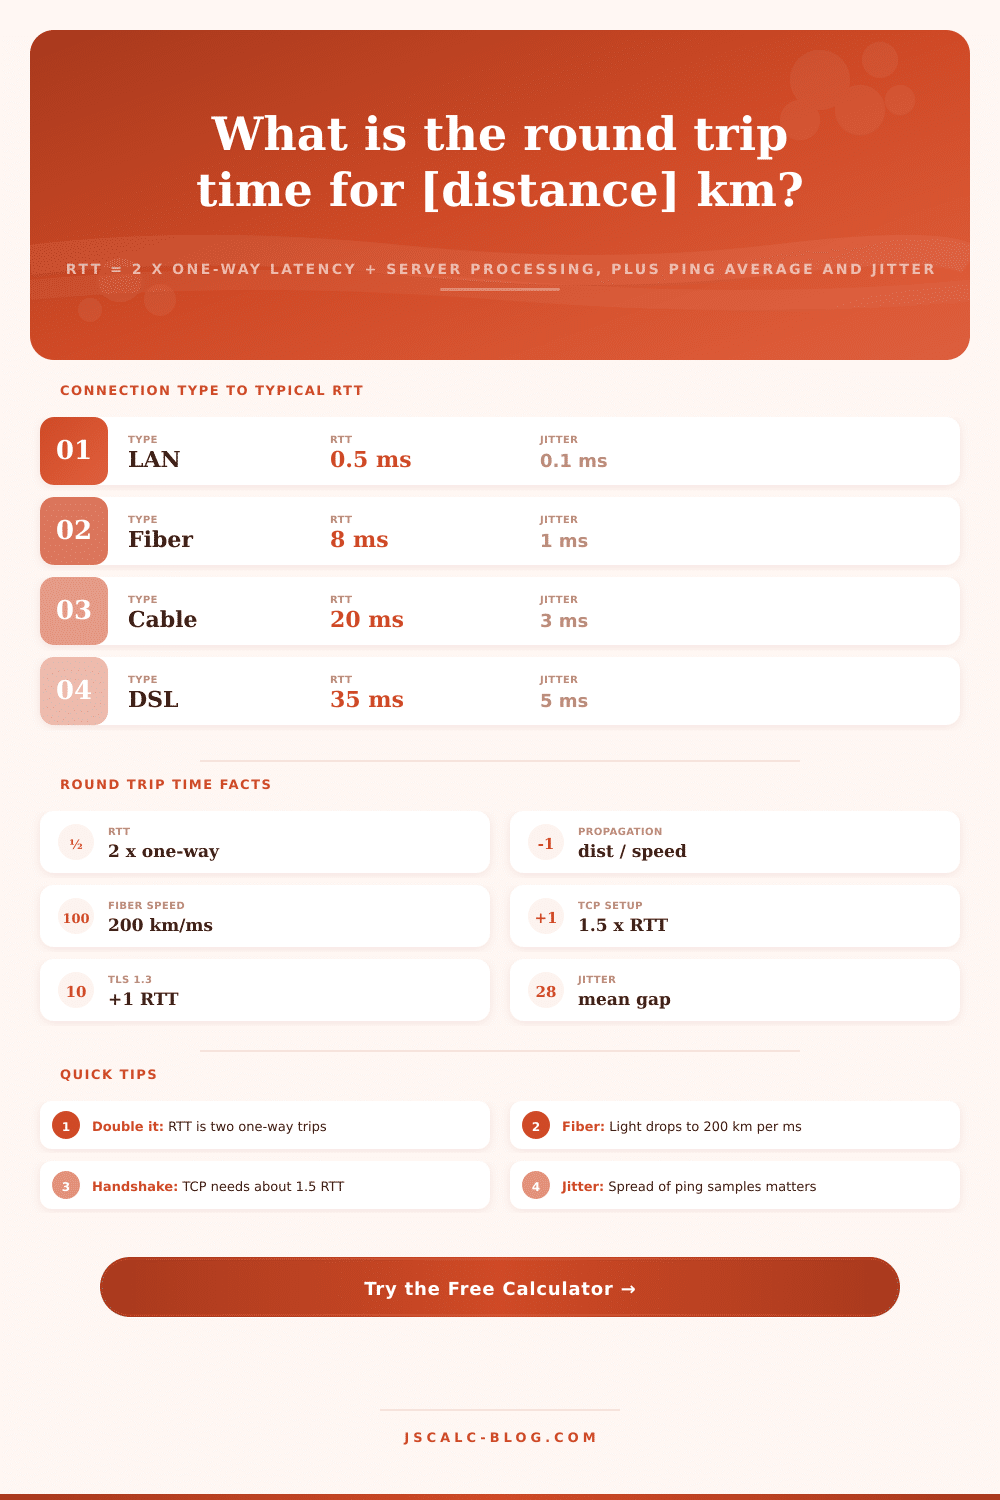
Estimate round trip time as RTT = 2 x one-way latency + server processing. Build the one-way latency from link distance and medium speed, add intermediate hops, then average a list of ping samples for jitter, TCP connection setup time, and a full page-load estimate over many round trips.
📡Choose an Input Method
🌐Real Network Presets
📝Link and Server Inputs
Straight cable path one way, not the physical crow-fly distance.
Applies to the distance field above.
Signal speed in the medium. Fiber runs near 0.67c due to refractive index.
Measured or estimated time for a packet to travel one direction.
Routers and switches between the two endpoints.
Queuing and forwarding delay added at each hop, one way.
Time the far host needs to turn the request around.
Paste round trip times from a ping run; average and jitter are derived.
Sequential request-response exchanges to render a page.
Controls rounding on every result card.
🔢Formula Snapshot
📋Typical RTT by Connection Type
| Connection | Typical RTT | Typical Jitter | What It Feels Like |
|---|---|---|---|
| Wired LAN gigabit | 0.2 to 1 ms | 0.1 ms | Instant, local |
| Home Wi-Fi 6 | 3 to 8 ms | 2 ms | Snappy indoors |
| Fiber broadband | 5 to 15 ms | 1 ms | Very responsive |
| Cable broadband | 15 to 30 ms | 3 ms | Good for most tasks |
| DSL broadband | 30 to 50 ms | 5 ms | Noticeable on games |
| 4G LTE mobile | 40 to 70 ms | 10 ms | Usable, variable |
| 5G mobile | 10 to 30 ms | 4 ms | Near fiber feel |
| Starlink LEO | 30 to 60 ms | 8 ms | Playable, rural |
| Geostationary sat | 500 to 700 ms | 40 ms | Long lag, browsing |
🗺City-Pair RTT Examples
| Route | Fiber Distance | Ideal RTT | Real-World RTT |
|---|---|---|---|
| New York to Chicago | 1300 km | 13 ms | 18 to 22 ms |
| New York to London | 5600 km | 56 ms | 70 to 80 ms |
| London to Frankfurt | 640 km | 6 ms | 10 to 14 ms |
| Los Angeles to Tokyo | 8800 km | 88 ms | 100 to 120 ms |
| London to Singapore | 11000 km | 110 ms | 150 to 180 ms |
| Sydney to Los Angeles | 12500 km | 125 ms | 140 to 170 ms |
| Mumbai to London | 7200 km | 72 ms | 110 to 130 ms |
| Same city metro | 50 km | 0.5 ms | 2 to 6 ms |
🎮Application RTT Tolerance
| Application | Ideal RTT | Usable Up To | Breaks Down Above |
|---|---|---|---|
| Competitive FPS games | Under 20 ms | 50 ms | 80 ms |
| Fighting games | Under 30 ms | 60 ms | 90 ms |
| Cloud gaming stream | Under 40 ms | 80 ms | 120 ms |
| Video calls | Under 100 ms | 200 ms | 300 ms |
| VoIP audio | Under 100 ms | 250 ms | 400 ms |
| Web browsing | Under 100 ms | 500 ms | 1000 ms |
| Financial trading | Under 1 ms | 5 ms | 20 ms |
| Remote desktop | Under 50 ms | 150 ms | 250 ms |
🗃Connection Comparison Grid
| Connection Type | Typical RTT | Jitter | Hops | One-Way | Best Use Case |
|---|---|---|---|---|---|
| Wired LAN | 0.5 ms | 0.1 ms | 1 to 2 | 0.25 ms | Local file transfer |
| Home Wi-Fi 6 | 6 ms | 2 ms | 2 to 3 | 3 ms | Streaming, browsing |
| Fiber broadband | 10 ms | 1 ms | 6 to 10 | 5 ms | Gaming, video calls |
| Cable broadband | 22 ms | 3 ms | 8 to 12 | 11 ms | General home use |
| DSL broadband | 38 ms | 5 ms | 8 to 14 | 19 ms | Basic connectivity |
| 4G LTE | 55 ms | 10 ms | 6 to 10 | 27 ms | Mobile on the move |
| 5G mid-band | 18 ms | 4 ms | 5 to 9 | 9 ms | Mobile low latency |
| Starlink LEO | 45 ms | 8 ms | 4 to 8 | 22 ms | Rural broadband |
| Geostationary sat | 600 ms | 40 ms | 3 to 6 | 300 ms | Remote coverage |
⚙Formula Breakdown
💡Latency Reduction Tips
The page is sitting on a server just twenty miles from you, yet it drags across the continent as you stare at a loading spinner refusing to dissapear. Why does the connection seem sluggish? You inspect your bandwidth and there’s plenty of headroom. No, the problem isn’t your download speed. It lie in the silence after you make your request and until server replies.
That silence is called round trip time. It determines if a website feels dead or snappy. A video call might sound like it’s playing through an old walkie talkie while the video appear fine. It is the invisible tax you pay each time you click a link.
Why Your Internet Feels Slow
But most of us are thinking about latency as distance: “A straight line from my modem to the data center and light gets there instantaneousy.” That’s not what happens. Fiber optic cable has a refractive index for glass which makes light slow down, to about two hundred kilometers per millisecond. So this calculator allow you to enter actual cable distance instead of straight-line miles.
That takes into account the physical laws, and then multiplies the one way propagation delay by 2 since the packet will go out and reply will have to come back. Then it adds on processing time at remote end. The remote machine doesn’t just echo your signal. It wakes up, reads request, figures out how to respond, and creates a response. Doubling the one way plus the processing fee is the gap between theoretical speed and actual perceived performance.
In reality, however, it’s never just one wire. There are usually multiple router and switches along that path, which means tiny amounts of delay at every step as packets wait to be forwarded. That eight-hopping route could appear perfectly straight, but all those stops add up. Maybe you get a super-fast last mile fiber connection, but your traffic go through three congested transit providers (then your round trip time balloons). So even two people who are both on the same ISP plan will see wildly different speeds based off how far away their server is and how many times it has to jump between hops to reach them.
After all, the average only tells part of the story. That’s why we measure variability too. That’s called jitter. While you can get away with a solid thirty millisecond ping for most things, one that bounces around from five to eighty make for a pretty disjointed experience. Voice protocols have trouble dealing with jarring spikes in ping since there isn’t much they can do to buffer long enough to fill in the gaps without adding unacceptable lag themselves.
This graph shows the spread of your ping samples (calculated by averaging them), so you know if your link is consistent or not. And when it comes to real-time applications such as remote desktops or gaming, low jitter is more important then raw speed, predictability beats throughput each time.
There’s overhead before any data goes anywhere. There’s a three-way handshake to establish the TCP connection (roughly one and a half round trips). Then you throw in TLS encryption, and you have to wait another full round trip before your very first byte gets sent. This latency cost of setting everything up is what the tool accounts for, so you know how much time is being spent simply saying hello.
That overhead isn’t even noticeable on a quick lookup. But if you’re loading a complex page with a dozen sequential requests, it’s a huge bottleneck. It adds up, one millisecond at a time per request-response cycle until user notices. In many cases, this can be better solved by reducing those round trips than by increasing the amount of bandwidth.
Multiplexing allows moddern protocols like HTTP/3 to send multiple requests over a single connection, so they should of not have to wait for each other’s handshakes. Placing your content nearer to your users using CDNs removes the distance variable altogether. Want to know why your cloud desktop isn’t feeling snappy? Take a look at its hop count and route. That will tell you whether it’s because of bad routing or physical distance. Engineering gets you close; physics sets the floor.
And lastly, knowing what pieces make up the puzzle makes the slowness less vague. It transforms it into something solvable and shifts the blame away from your internet provider to where it belongs: the mechanics of how the thing connects.