Wave Energy Calculator
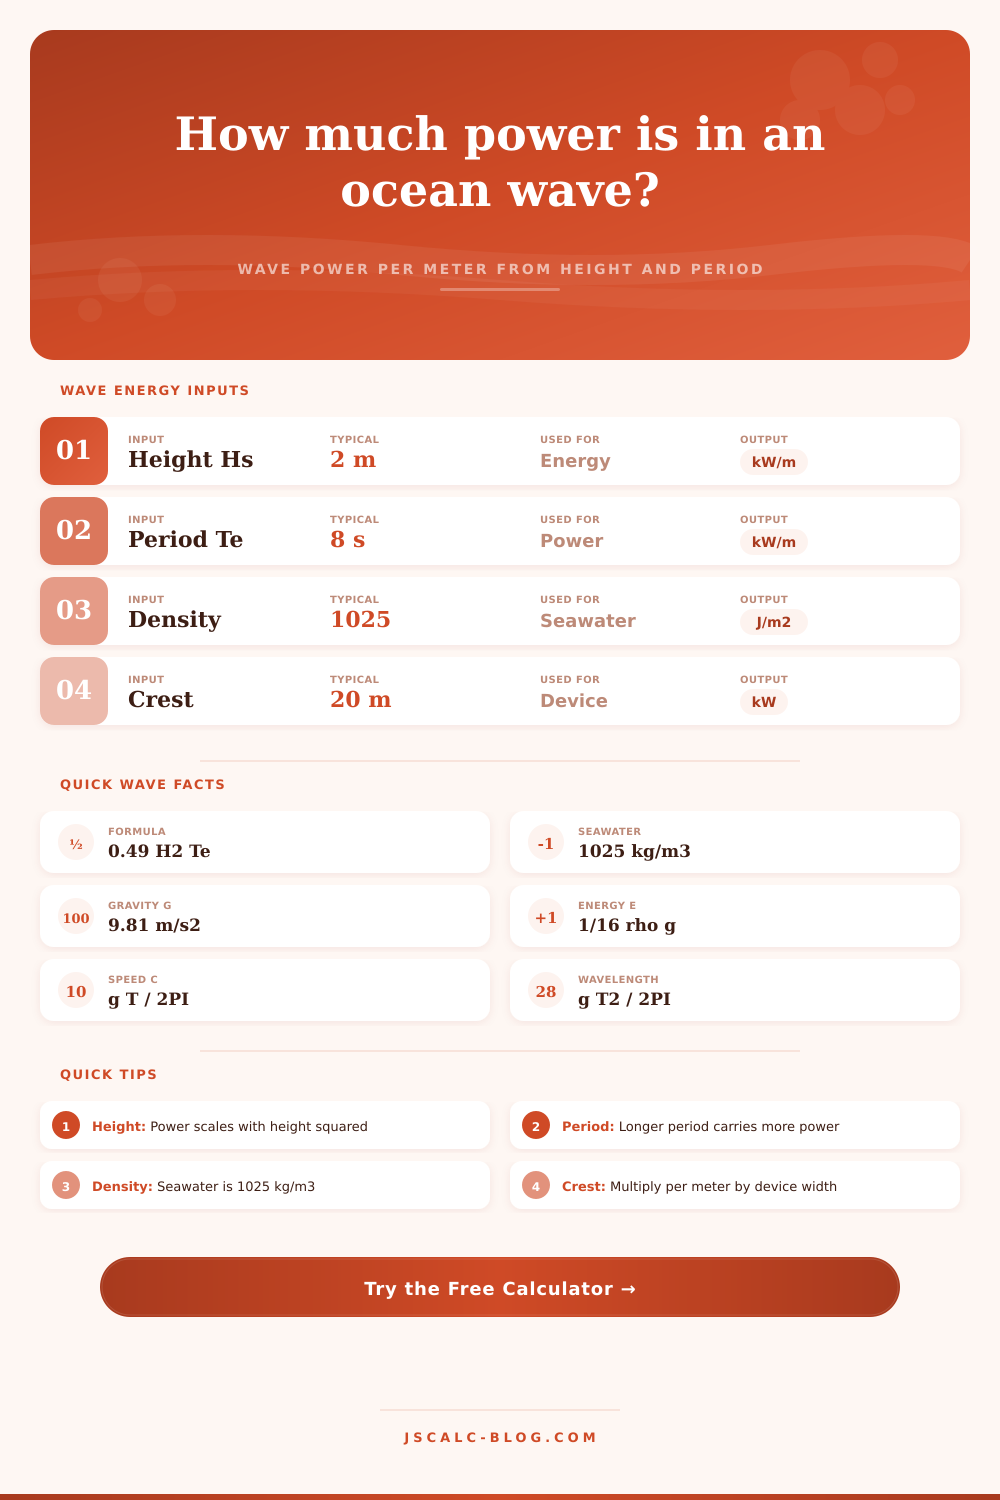
Estimate ocean wave power per meter of crest, wave energy density, wavelength, deep-water wave speed, and total farm output from significant wave height and energy period using deep-water linear wave theory.
🌊Real Sea-State Presets
📝Wave and Device Inputs
Average height of the highest one third of waves.
Peak or mean zero-crossing wave period.
Seawater 1025, fresh water about 1000.
Width of wave front captured by one device.
Fraction of raw wave power the WEC converts.
🔢Formula Snapshot
📊Wave Power by Height and Period
| Hs × Te | Te = 6 s | Te = 8 s | Te = 10 s | Te = 12 s | Te = 14 s |
|---|---|---|---|---|---|
| Hs = 0.5 m | 0.74 kW/m | 0.98 kW/m | 1.23 kW/m | 1.47 kW/m | 1.72 kW/m |
| Hs = 1.0 m | 2.94 kW/m | 3.92 kW/m | 4.91 kW/m | 5.89 kW/m | 6.87 kW/m |
| Hs = 2.0 m | 11.8 kW/m | 15.7 kW/m | 19.6 kW/m | 23.5 kW/m | 27.5 kW/m |
| Hs = 3.0 m | 26.5 kW/m | 35.3 kW/m | 44.2 kW/m | 53.0 kW/m | 61.8 kW/m |
| Hs = 5.0 m | 73.6 kW/m | 98.1 kW/m | 123 kW/m | 147 kW/m | 172 kW/m |
| Hs = 8.0 m | 188 kW/m | 251 kW/m | 314 kW/m | 377 kW/m | 440 kW/m |
🌎Sea State and Beaufort Reference
| Sea State | Beaufort | Wind (kn) | Hs Range | Typical Te |
|---|---|---|---|---|
| Calm glassy | 0 | 0 to 1 | 0 m | - |
| Smooth | 2 | 4 to 6 | 0.1 to 0.5 m | 4 to 6 s |
| Slight | 3 to 4 | 7 to 16 | 0.5 to 1.25 m | 5 to 7 s |
| Moderate | 5 | 17 to 21 | 1.25 to 2.5 m | 6 to 9 s |
| Rough | 6 to 7 | 22 to 33 | 2.5 to 4 m | 8 to 11 s |
| Very rough | 8 | 34 to 40 | 4 to 6 m | 10 to 13 s |
| High to storm | 9 to 11 | 41 to 63 | 6 to 14 m | 12 to 18 s |
⌚Energy Period, Speed and Wavelength
| Energy Period Te | Wave Speed c | Wavelength L | Frequency | Regime Note |
|---|---|---|---|---|
| 4 s | 6.2 m/s | 25 m | 0.250 Hz | Short wind sea |
| 6 s | 9.4 m/s | 56 m | 0.167 Hz | Local wind waves |
| 8 s | 12.5 m/s | 100 m | 0.125 Hz | Mixed sea and swell |
| 10 s | 15.6 m/s | 156 m | 0.100 Hz | Developed swell |
| 12 s | 18.7 m/s | 225 m | 0.083 Hz | Long ocean swell |
| 15 s | 23.4 m/s | 351 m | 0.067 Hz | Distant storm swell |
⚙Full Formula Breakdown
🗂Wave Energy Scenario Comparison
| Scenario | Hs | Te | Power kW/m | Wavelength | Notes |
|---|---|---|---|---|---|
| Calm bay | 1.0 m | 6 s | 2.94 | 56 m | Low resource site |
| Moderate coast | 2.0 m | 8 s | 15.7 | 100 m | Typical nearshore |
| Storm swell | 5.0 m | 12 s | 147 | 225 m | High but intermittent |
| Atlantic swell | 3.5 m | 11 s | 66.1 | 189 m | Strong Europe west coast |
| Pacific wave | 2.5 m | 10 s | 30.6 | 156 m | Consistent long swell |
| Big-wave surf | 8.0 m | 14 s | 440 | 306 m | Extreme rare event |
📋Wave Energy Potential Examples
| Location Type | Mean Power | Resource | Note |
|---|---|---|---|
| Sheltered lake | 1 to 3 kW/m | Very low | Limited fetch and short period |
| Mediterranean coast | 4 to 10 kW/m | Low | Seasonal wind-driven seas |
| US Pacific coast | 20 to 40 kW/m | High | Reliable Pacific swell |
| North Atlantic west | 40 to 70 kW/m | Very high | Ireland, Scotland, Portugal |
| Southern Ocean | 60 to 100 kW/m | Extreme | Strongest sustained wave climate |
💡Practical Wave Energy Tips
Wind sweeping over an ocean surface produce waves. These waves produce swells which is carried to the shoreline in a regular way. To harness that power require something more than just some floating contraption. It requires understanding how water moves. The water contains packets of both potential and kinetic energy, and the amount of this energy depend on interval between crests and height of the wave.
The calculator does all this for you. Just input the period and significant wave height of your location. That eliminates guesswork for the fluid dynamics equations.
How to Calculate Wave Energy
The first order factor is wave height. People fixate on speed and volume and miss it. The amount of power go up at the rate of the square of the height. That means that doubling the wave height result in quadrupling the power available along each meter of crest. A two-metre sea state isn’t simply twice as powerful than a one-metre swell; it’s four times more so. This uneven relationship make the developer’s problem with finding sites difficult. They can’t thin out their devices over a wide area to capture average conditions. They require spots where the resource is concentrated. The page’s table of references illustrate this well. As you get into the area of storm surge versus calm bay conditions, kilowatt/meter goes up quickly.
But there’s also another aspect; period matters. It happens linearly. Generally speaking, longer periods corresponds to swell waves. These waves have traveled great distances from where they were born. Instead of choppy wind sea (from local winds), these become long rollers that has smoothed out during their journey. And they’re easier for converters to use because they offer a longer window of engagement with the device and thus contain greater energy. The tool automatically calculates mean zero-crossing period, energy period and peak period. No need for you to look into the spectral data.
Standard coefficients used by oceanographic engineers gives you a realistic estimate of what can be captured. Pure physics doesn’t include losses encountered when things is deployed in real world. In theory your site can have thirty kilowatts per meter of power. No converter is going to capture all of that resource. Use efficiency input to model reality. Include losses due to hydrodynamic drag, mechanical transmission, and electrical conversion. Under optimal conditions most commercial prototypes hope to achieve a capture efficiency of twenty to forty percent.
Additionally, think about how wide your device is and where it sits within the farm. A single point absorber will only interact with a small portion of the wave front. An attenuator will span multiple meters. Multiply the raw input (power per meter) times the length of the crest that’s actively engaged by your device. Then subtract for losses in efficiency.
Remember: deep water vs. Shallow water regimes. The wave formulas used above are for deep-water conditions. By definition, this refers to a situation where depth of water is greater than one-half the length of the wave. For the vast majority of offshore projects, this will be the case. As waves near the shore, they begins to slow down. As waves get shallower, they can shorten their wavelength and increase in height in some cases. This greatly changes the energy density profile. Such deep-water approximations can provide a first screening for offshore sites. More subtle models considering seabed shape is needed for nearshore installations.
A primary difficulty in developing wave energy are that resource variability is high. Wind exhibits seasonality; solar, a repeatable daily pattern. Storms hundreds of miles away can cause sea state shifts in hours. One day a site may provide great power, the next none at all. This leads to higher costs for integrating into the grid or storing. Before making an investment, consistent resource assessment is key. Stay away from sites whose resources only spike during extremely rare storm events. Building hardware capable of surviving them would of be far too costly during mild conditions the remaining days of the year.
Matching tech with nature is the key. Harnessing ocean waves as dependable power means accepting both the power of nature and the limits of your machinery. Combining efficiency, height, and period create a way to see if a location produces enough constant power to make engineering sense. Engineering takes time. Mother Ocean won’t pause while waiting and she repays those who understand her cycles.