Sample Size Calculator
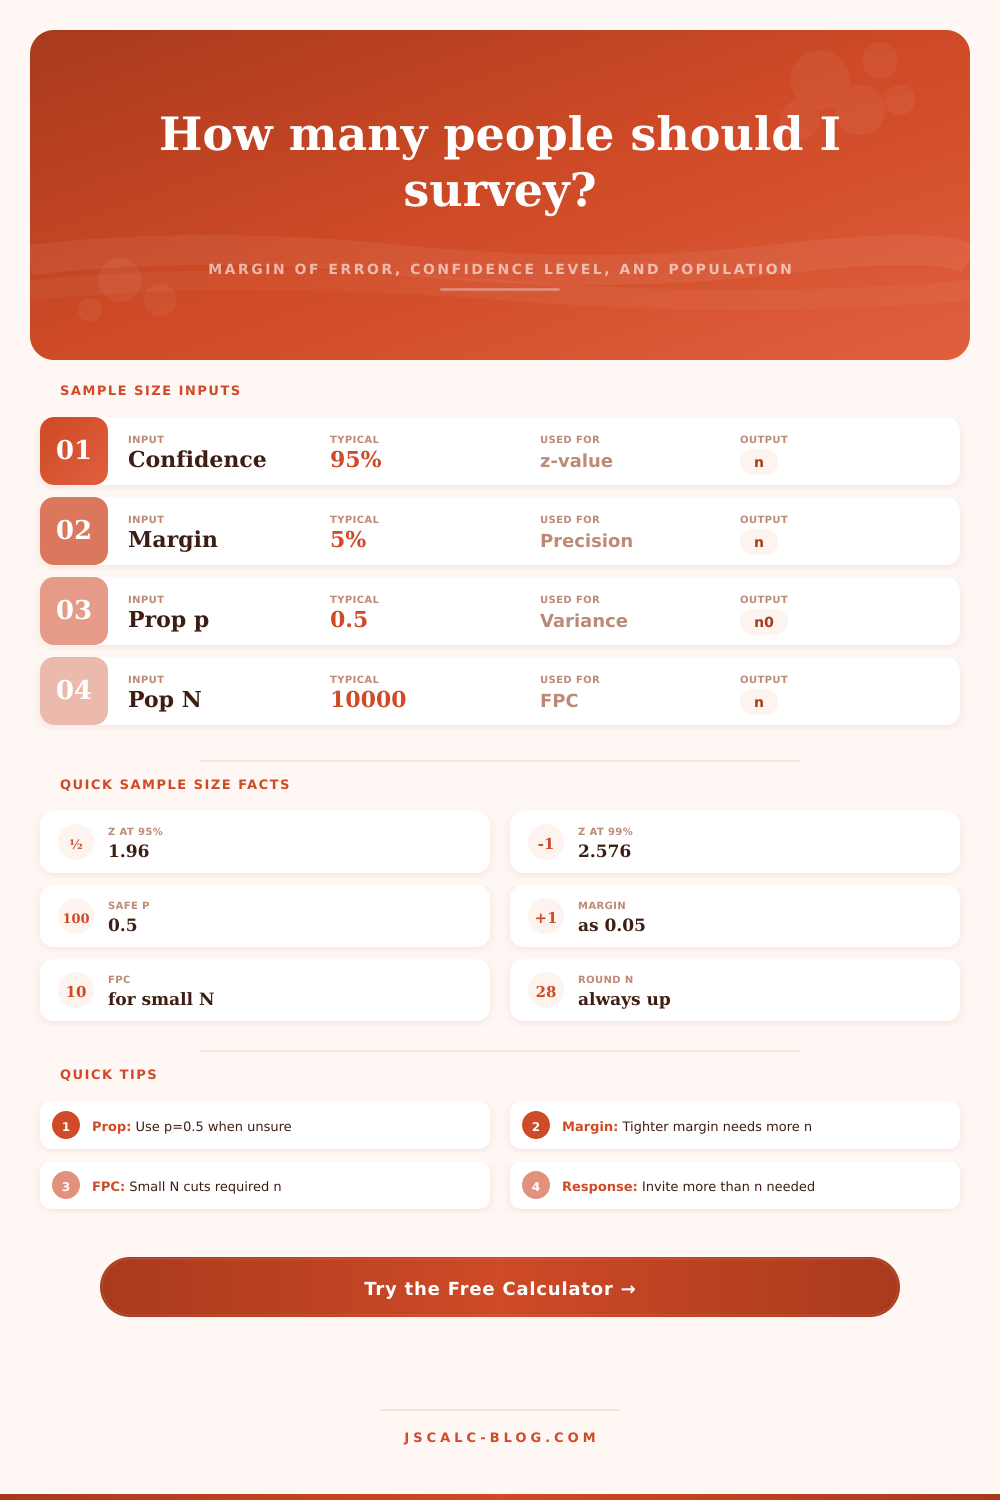
Find how many survey responses you need from your target margin of error and confidence level, for both proportions and means, with an optional finite population correction and a response-rate adjustment for invitations.
🎯Real Survey Presets
📝Survey Inputs
Proportion uses p(1–p); mean uses the standard deviation.
Used only when confidence is set to Custom. Range 50 to 99.99.
Enter 5 for ±5 percentage points. Used for proportion mode.
Use 0.5 when unknown; it gives the largest, safest n.
Absolute precision in the same units as the mean.
Used for mean mode. Estimate from a pilot or prior data.
Leave 0 for an unknown or very large population.
If 40% reply, you must invite more than n to reach n.
🔢Formula Snapshot
📊Sample Size at 95% by Margin & Population
| Margin of Error | Infinite / Large | N = 100,000 | N = 10,000 | N = 1,000 | N = 500 |
|---|---|---|---|---|---|
| ±1% | 9,604 | 8,763 | 4,900 | 906 | 476 |
| ±2% | 2,401 | 2,345 | 1,936 | 706 | 415 |
| ±3% | 1,068 | 1,056 | 965 | 517 | 341 |
| ±4% | 601 | 597 | 566 | 376 | 274 |
| ±5% | 385 | 383 | 370 | 278 | 217 |
| ±7% | 196 | 196 | 193 | 164 | 141 |
| ±10% | 97 | 97 | 96 | 88 | 81 |
All values use the safest assumption p = 0.5 and z = 1.96. Larger populations barely change n once N is in the tens of thousands.
📐z-Value Reference Table
| Confidence Level | Two-Tailed z | Alpha (α) | Common Use |
|---|---|---|---|
| 80% | 1.282 | 0.20 | Rough internal reads |
| 85% | 1.440 | 0.15 | Quick pilot checks |
| 90% | 1.645 | 0.10 | Exploratory surveys |
| 95% | 1.960 | 0.05 | Standard for most research |
| 98% | 2.326 | 0.02 | Higher-stakes decisions |
| 99% | 2.576 | 0.01 | Medical and safety work |
| 99.9% | 3.291 | 0.001 | Very high certainty |
🧮Effect of Expected Proportion p on n
| Proportion p | p(1–p) | n at 95%, ±5% | n at 95%, ±3% | Notes |
|---|---|---|---|---|
| 0.10 or 0.90 | 0.09 | 139 | 385 | Skewed split needs less n |
| 0.20 or 0.80 | 0.16 | 246 | 683 | Still below the maximum |
| 0.30 or 0.70 | 0.21 | 323 | 897 | Rising toward the peak |
| 0.40 or 0.60 | 0.24 | 369 | 1,025 | Near the largest value |
| 0.50 | 0.25 | 385 | 1,068 | Maximum variance, safest |
Variance p(1–p) peaks at p = 0.5, so using 0.5 guarantees you never undersize the study.
⚙Full Formula Breakdown
🗂Finite Population Correction Reference
| Population N | n0 (No FPC) | n With FPC | Sampling % | Reduction | When It Matters |
|---|---|---|---|---|---|
| 100 | 385 | 80 | 80% | −79% | Large effect |
| 250 | 385 | 152 | 61% | −61% | Large effect |
| 500 | 385 | 217 | 43% | −44% | Strong effect |
| 1,000 | 385 | 278 | 28% | −28% | Clear effect |
| 5,000 | 385 | 357 | 7% | −7% | Small effect |
| 10,000 | 385 | 370 | 4% | −4% | Minor effect |
| 50,000 | 385 | 382 | 1% | −1% | Negligible |
| 1,000,000 | 385 | 385 | 0% | −0% | Effectively none |
Base case: 95% confidence, ±5% margin, p = 0.5 (n0 = 385). The correction only bites hard when the population is small relative to n0.
📋Confidence & Margin Comparison Grid
| Scenario | Confidence | Margin | p / σ | Population | Required n |
|---|---|---|---|---|---|
| Classic web survey | 95% | ±5% | p = 0.5 | Large | 385 |
| Strict national poll | 99% | ±3% | p = 0.5 | Large | 1,844 |
| Small member list | 95% | ±5% | p = 0.5 | N = 800 | 260 |
| Precise brand study | 95% | ±2% | p = 0.5 | Large | 2,401 |
| Political tracking | 95% | ±3% | p = 0.5 | Large | 1,068 |
| Mean rating estimate | 95% | ±2 units | σ = 15 | Large | 217 |
💡Practical Sampling Tips
So, how do I recruit? You want a specific answer with little means of getting it. How many response will be enough to produce valid results? This is what the calculator do: translate your statistical needs into an attainable number. Then it handles all the math while you handle recruiting.
There’s just a tradeoff between cost and precision, that means changing margin of error determines your required sample size. The larger the margin, the fewer people is needed. At the 95% confidence level most online surveys has a plus/minus five percent margin. That’s roughly 385 people for large populations. Why? Because it’s a nice mix of rigorous and realistic.
How to Choose the Right Sample Size
Shrink the margin down to one percent and suddenly you’re in the thousands. Costs scale quadratically while the gain in precision look linear on a chart. More than you’d expect, the confidence level matters. This indicates how sure you want to be that your result falls within your stated margin. At ninety-five percent confidence, this mean we have a five in one hundred chance of not hitting our mark. In medical safety situations where a decision could save your life, you might want ninety-nine percent certainty. To do so would of take an extremely large sample size. The z-value goes up from approximately two to well above two point five. At stakes like these, you need to pay the price of a higher z-score if the consequence of getting it wrong are serious.
The number of people to sample is an often-overlooked factor for many newbies. They think sampling one million people is way more harder than sampling ten thousand. But it’s not. For populations larger than 50k, the calculations don’t differ significantly. The calculator only adjusts with a finite population correction when you’re working with relatively small numbers. And if you’re surveying staff at a mid-sized company, then that adjustment will cut down your target dramatically. There’s no reason to get three hundred responses when there are only five hundred person in the building.
Another mistake people make is with the “expected proportion” setting. If you don’t have any idea what the breakdown will be (i.e., 20% say yes and 80% say no), then put in 50%. Seems weird, right? You have zero baseline info on this so why would you guess half? Statistically speaking, it’s safer. The middle ground has the most variance. Guessing low could cost you money upfront. It could also cause you to undersize your study, meaning results won’t actualy pick up on real differences. Better to err on the high side then run an underpowered survey and not see anything.
Theory meets reality in response rates. The tool prompts you for your anticipated response rate, and calculates how many invites you need to send. It is not the survey completions, but the number of people it needs to invite to reach its target sample. History shows a 40% response rate? Then you need to invite 500 people to get responses from 200. This will save you from blowing your budget and missing your deadline if you fail to account off this fact. Hope for engagement late, but plan for disengagement early on.
That’s not guaranteeing those #s, that’s telling you what sample size is required. That doesn’t tell you who to pick. Regardless of your sample size, bad data is bad data. First get focused on having a good representation in your sample. Second, apply this to figure out what sample size gives you enough confidence based off valid responses. It is better to have a small and well-selected sample than a large and biased one.