Hourly to Annual Salary Calculator
Convert any hourly wage into a full-year salary and see the matching weekly, biweekly, semimonthly, and monthly gross pay. Add overtime, unpaid vacation weeks, and paid holidays for a realistic annualized number.
🎯Real Wage Presets
📝Wage and Schedule Inputs
Used to split weekly pay into a daily rate.
Subtracted from weeks worked to lower yearly pay.
Paid days are treated as worked and do not cut pay.
🔢Key Numbers Snapshot
📊Your Pay-Period Breakdown
| Pay Period | Gross Pay | Periods / Year | How It Is Found |
|---|---|---|---|
| Enter values above to see every pay period. | |||
📈Hours-Per-Week Impact
| Schedule | Hours / Week | Annual Hours | Annual Salary | Vs Full-Time |
|---|---|---|---|---|
| The part-time versus full-time table appears after calculation. | ||||
📆Weeks-Worked Impact
| Paid Weeks | Unpaid Weeks | Annual Hours | Annual Salary | Change vs 52 |
|---|---|---|---|---|
| The weeks-worked comparison appears after calculation. | ||||
🗂Common Wage to Annual Reference
| Hourly | Weekly (40h) | Biweekly | Monthly | Annual (2080h) |
|---|---|---|---|---|
| $10.00 | $400 | $800 | $1,733 | $20,800 |
| $12.00 | $480 | $960 | $2,080 | $24,960 |
| $15.00 | $600 | $1,200 | $2,600 | $31,200 |
| $18.00 | $720 | $1,440 | $3,120 | $37,440 |
| $20.00 | $800 | $1,600 | $3,467 | $41,600 |
| $25.00 | $1,000 | $2,000 | $4,333 | $52,000 |
| $30.00 | $1,200 | $2,400 | $5,200 | $62,400 |
| $40.00 | $1,600 | $3,200 | $6,933 | $83,200 |
| $50.00 | $2,000 | $4,000 | $8,667 | $104,000 |
| $60.00 | $2,400 | $4,800 | $10,400 | $124,800 |
🗃Scenario Comparison Grid
| Scenario | Wage | Hours/Wk | Weeks | Overtime | Annual Salary |
|---|---|---|---|---|---|
| $15/hr full-time | $15.00 | 40 | 52 | None | $31,200 |
| $20/hr standard | $20.00 | 40 | 52 | None | $41,600 |
| $25/hr with 2wk unpaid PTO | $25.00 | 40 | 50 | None | $50,000 |
| $18/hr part-time | $18.00 | 25 | 52 | None | $23,400 |
| $30/hr contractor 48wk | $30.00 | 40 | 48 | None | $57,600 |
| $45/hr nurse w/ 4 OT hrs | $45.00 | 36 | 52 | 4h @ 1.5× | $98,280 |
| $22/hr at 37.5h | $22.00 | 37.5 | 52 | None | $42,900 |
| $50/hr consultant 46wk | $50.00 | 40 | 46 | None | $92,000 |
⚙Full Formula Breakdown
📋Input Reference Guide
| Input | Common Entry | How It Is Used | Effect on Annual |
|---|---|---|---|
| Hourly wage | $12 to $60 | Base for every period | Direct, scales all pay up |
| Hours per week | 20 to 45 | Weekly hours × weeks | More hours raise the total |
| Weeks worked | 48 to 52 | Multiplies weekly pay | Fewer weeks lower the total |
| Unpaid vacation | 0 to 4 weeks | Cuts effective weeks | Each week trims yearly pay |
| Paid holidays | 0 to 12 days | Counted as worked | No cut when hours are paid |
| Overtime hours | 0 to 10 per week | Paid at the multiplier | Adds premium pay yearly |
💡Practical Wage Tips
Your offer letter appears impressive. But when you attempt to plug it in to the rent check, it’s all smoke and mirrors. That year-long number is pretty sweet, but does the paycheck leave enough for livig? Here’s a hourly to annual salary calculator, from JSCalc-Blog.com. It calculate weekly gross pay, monthly, biweekly, semi-monthly and annually. It even accounts for paid holidays and unpaid week.
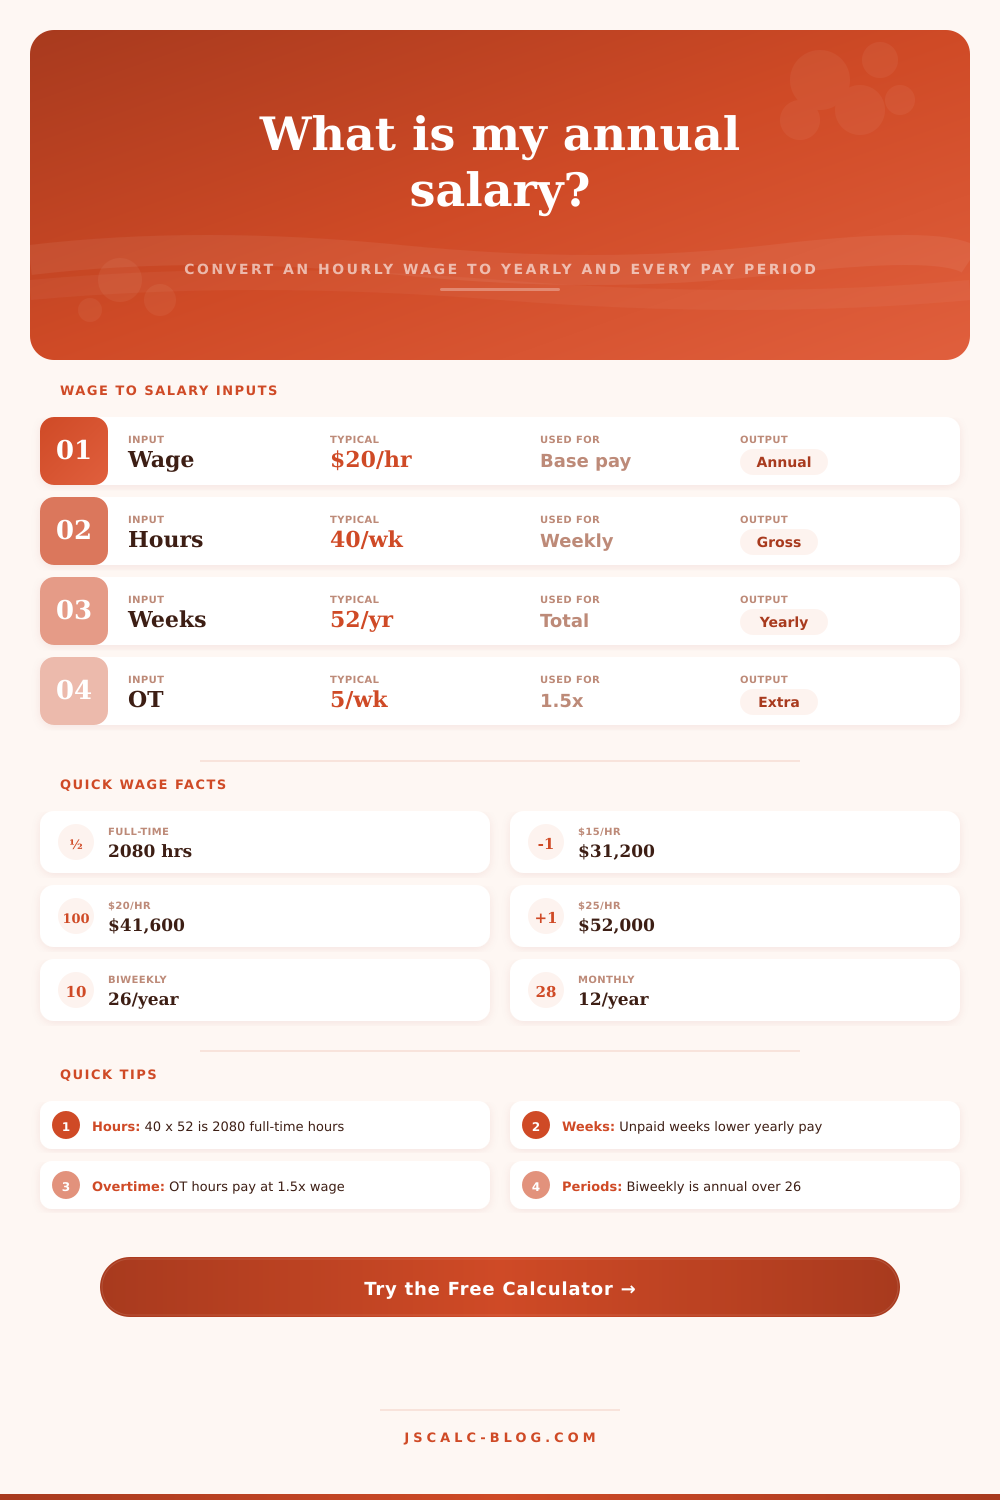
The problem lies with our visualizations of money. On one hand, you work certain hours; on the other hand, your bills is due at various times on a calendar. We need something bigger than simply doubling the amount, we need to understand how your paycheck are built. One common piece of advice: multiply your hourly wage by two thousand to estimate your annual earnings. This assume you work forty straight hours each week, fifty-two weeks per year. Does that sound familiar? Not so much.
How to Calculate Your Annual Salary from Hourly Wage
Few folks clock in full time all five days of the week; we take vacations, call in sick, or work part-time shift that don’t quite fill our buckets with 40 hours per week. The calculator up top account for this reality… Enter number of unpaid vacation weeks plus the number of paid holidays. Why does it matter? Because working a paid holiday earn you cash in your pocket. Working an unpaid vacation week shuts off your earnings flow. Failing to account for this mean over-estimating your annual salary … and creating a fragile situation when you try to budget your dollars.
How about overtime? Overtime is another one of those things which many employee think will contribute a direct increase to their annual earnings. But once you factor in premium pay, the math change. A few additional hours each week at time-and-a-half translates into 15% higher hourly value during that chunk of time, not simply five hours of base pay. The calculator take this multiplier into account. You’ll see that even a small amount of overtime hour worked per week can greatly increase your gross annual total compared to sticking to a rigid forty-hours-per-week routine. This is especially true if you work in an industry where overtime is standard practice (e.g., construction, healthcare) different than an oddity. Knowing the premium will help you decide if it’s realy worthwhile to grind for some extra cash, at the cost of your personal time.
Then again, there’s the structure of your pay period. Does your company pay you biweekly (twenty-six checks per year) or semimonthly (twenty-four)? It seems like a trivial bit of administrative detail, but as far as your cash flow rhythm goes, it make a difference. If you’re on a biweekly schedule, you’ll be getting a paycheck every other Friday. Twice a month, meanwhile, will likely drop the check on either the first or fifteenth of the month, regardless of which day that falls on. Under the former, your cash flow will have weeks where you’re getting two consecutive check. And people tend to blow through that additional money, failing to remember that it’s simply an advance against their next month’s pay.
The table of references on the page break this all down nicely: How does your annual take divide up into different intervals? Plan accordingly for those lean weeks between double-periods.
Also note: These numbers is gross (that is), pre-deductions and pre-tax dollars. That “six-figures” could turned into something more like $80,000. This happens if you live in a high-tax state and account for Social Security, federal and state withholdings, and retirement contributions. Those factors can vary based off where you live, your tax-filing status, and which benefits you elect to recieve. So this calculator doesn’t show you how much you’ll take home. But that’s the starting point, and understanding your gross income is key to having an honest financial plan.
It’s the ceiling, so it tells us how much money we could of theoretically have to put toward saving or spending. It’s about taking the guesswork out of converting an hourly wage to a full yearly perspective. Whether it’s when negotiating a new job offer, saving for a major purchase, or just getting a handle on your monthly expenses, knowing your exact numbers helps avoid nasty surprises. Once you type in the number of weeks and hours you work, the calculator do all the math; no more worrying over overtime multipliers or pay cycle confusion. All that’s left is a realistic picture of your earning power. And that clarity is what transforms a confusing paycheck into something you can manage.