Annual Discount Rate Calculator
Work the time value of money with PV = FV / (1 + r)^n. Find the present value of a future sum, solve for the annual discount rate implied by a price today, or grow a present value to a future target. It also reports the discount factor, effective annual rate under any compounding, total discount, and a year-by-year schedule.
📈Choose What to Solve
🎯Real Finance Scenarios
📝Cash Flow Inputs
The lump sum you receive or owe in the future.
Value now. Used in Find Rate and Find Future Value.
Your required return, WACC, or hurdle rate.
Time between today and the future cash flow.
Periodic rate r/m over n×m periods.
Rounding applied to dollar amounts.
🔢Formula Snapshot
📋Year-by-Year Discount Schedule
| Year | Discount Factor | PV of FV | Discount to Date |
|---|
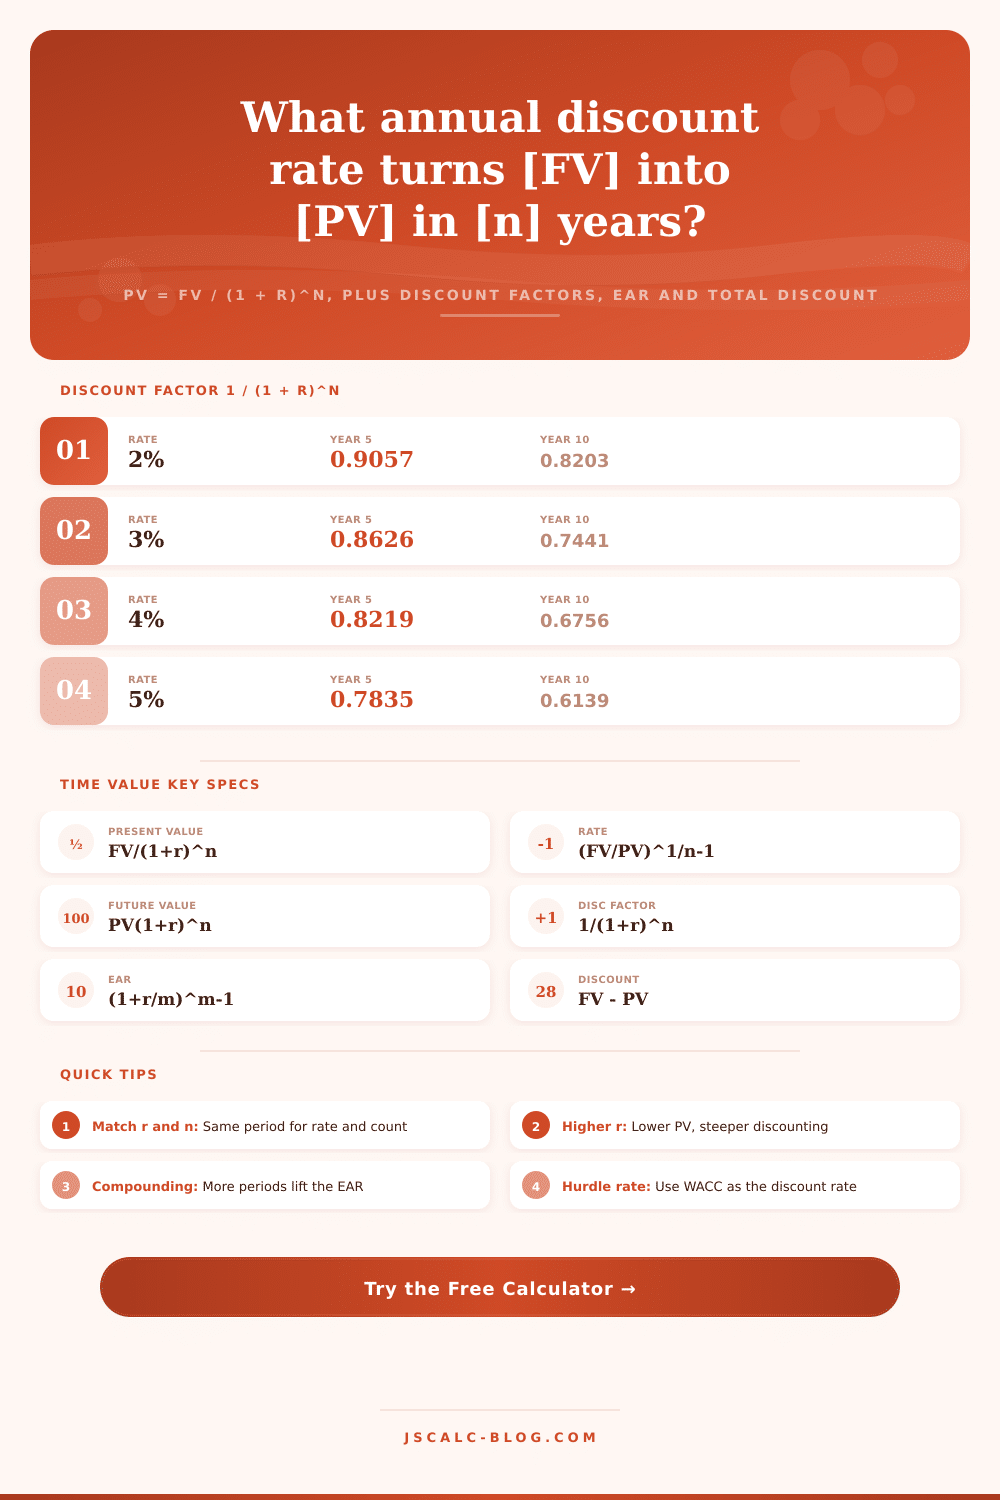
📊Discount Factor Table 1 / (1 + r)^n
| Rate | Year 1 | Year 2 | Year 3 | Year 5 | Year 7 | Year 10 |
|---|---|---|---|---|---|---|
| 2% | 0.9804 | 0.9612 | 0.9423 | 0.9057 | 0.8706 | 0.8203 |
| 3% | 0.9709 | 0.9426 | 0.9151 | 0.8626 | 0.8131 | 0.7441 |
| 4% | 0.9615 | 0.9246 | 0.8890 | 0.8219 | 0.7599 | 0.6756 |
| 5% | 0.9524 | 0.9070 | 0.8638 | 0.7835 | 0.7107 | 0.6139 |
| 6% | 0.9434 | 0.8900 | 0.8396 | 0.7473 | 0.6651 | 0.5584 |
| 8% | 0.9259 | 0.8573 | 0.7938 | 0.6806 | 0.5835 | 0.4632 |
| 10% | 0.9091 | 0.8264 | 0.7513 | 0.6209 | 0.5132 | 0.3855 |
| 12% | 0.8929 | 0.7972 | 0.7118 | 0.5674 | 0.4523 | 0.3220 |
| 15% | 0.8696 | 0.7561 | 0.6575 | 0.4972 | 0.3759 | 0.2472 |
💵Present Value of $1,000 at Various Rates
| Rate | 1 Year | 3 Years | 5 Years | 10 Years | 20 Years | 30 Years |
|---|---|---|---|---|---|---|
| 3% | $970.87 | $915.14 | $862.61 | $744.09 | $553.68 | $411.99 |
| 4% | $961.54 | $889.00 | $821.93 | $675.56 | $456.39 | $308.32 |
| 5% | $952.38 | $863.84 | $783.53 | $613.91 | $376.89 | $231.38 |
| 6% | $943.40 | $839.62 | $747.26 | $558.39 | $311.80 | $174.11 |
| 8% | $925.93 | $793.83 | $680.58 | $463.19 | $214.55 | $99.38 |
| 10% | $909.09 | $751.31 | $620.92 | $385.54 | $148.64 | $57.31 |
| 12% | $892.86 | $711.78 | $567.43 | $321.97 | $103.67 | $33.38 |
| 15% | $869.57 | $657.52 | $497.18 | $247.18 | $61.10 | $15.10 |
⏳Annual vs Periodic Compounding Effect
| Nominal Rate | Annual EAR | Semiannual | Quarterly | Monthly | Daily |
|---|---|---|---|---|---|
| 2% | 2.0000% | 2.0100% | 2.0151% | 2.0184% | 2.0201% |
| 4% | 4.0000% | 4.0400% | 4.0604% | 4.0742% | 4.0808% |
| 5% | 5.0000% | 5.0625% | 5.0945% | 5.1162% | 5.1267% |
| 6% | 6.0000% | 6.0900% | 6.1364% | 6.1678% | 6.1831% |
| 8% | 8.0000% | 8.1600% | 8.2432% | 8.2999% | 8.3278% |
| 10% | 10.0000% | 10.2500% | 10.3813% | 10.4713% | 10.5156% |
| 12% | 12.0000% | 12.3600% | 12.5509% | 12.6825% | 12.7475% |
🌐Where Discount Rates Come From
| Use Case | Typical Rate | Basis | Applied To |
|---|---|---|---|
| Risk-free rate | 3% – 5% | 10-year Treasury yield | Safe cash flows |
| WACC (large cap) | 7% – 9% | Blended debt and equity cost | Company DCF valuation |
| Corporate hurdle | 10% – 15% | WACC plus project margin | Capital budgeting |
| Venture / startup | 25% – 60% | High risk, illiquidity | Early-stage equity |
| Inflation only | 2% – 4% | CPI expectation | Real purchasing power |
| Pension / annuity | 4% – 6% | Long-bond discount curve | Lump-sum offers |
| Real estate cap | 5% – 8% | Net operating income yield | Property value |
🗃Rate Comparison Grid ($10,000 future value)
| Rate | DF @ 5yr | DF @ 10yr | PV of $10k @ 5yr | EAR if Quarterly | Typical Use Case |
|---|---|---|---|---|---|
| 2% | 0.9057 | 0.8203 | $9,057 | 2.0151% | Near risk-free |
| 3% | 0.8626 | 0.7441 | $8,626 | 3.0339% | Inflation proxy |
| 4% | 0.8219 | 0.6756 | $8,219 | 4.0604% | Risk-free bond |
| 5% | 0.7835 | 0.6139 | $7,835 | 5.0945% | Pension discount |
| 6% | 0.7473 | 0.5584 | $7,473 | 6.1364% | Real estate cap |
| 8% | 0.6806 | 0.4632 | $6,806 | 8.2432% | Corporate WACC |
| 10% | 0.6209 | 0.3855 | $6,209 | 10.3813% | Equity return |
| 12% | 0.5674 | 0.3220 | $5,674 | 12.5509% | Project hurdle |
| 15% | 0.4972 | 0.2472 | $4,972 | 15.8650% | Growth venture |
⚙Formula Breakdown
💡Discount Rate Tips
The single most important thing to know about money is that a dollar in hand today is worth more then a dollar you’re promised in five years. That’s what discounting future dollars means: We take into account the fact that waiting makes money less valuable. That’s where this page’s annual discount rate calculator kicks in, performing all that hard work for you so you can understand exactly how money loses value as time passes. Plug in future value, back out the implied rate or project a future target, but use these tools mostly to learn what they imply for your choices.
“Time is money,” or so they say. But how much? What’s the “price of time”? This is your discount rate. It’s what you think you’d earn on that money if you didn’t wait but invested it somewhere else. Suppose your discount rate is 5%. Then each additional year of waiting reduces the value of that eventual payoff by a factor of 1.05. Five years later, $10,000 becomes worth about $7,835 today (yes, thanks to compounding!). The calculator above does the math for you, right away, revealing exactly how much value you’ve lost.
Why Money Today Is Worth More Than Money Later
That’s where most folks fail to account for it. They look at big number ($10,000) but ignore the thousands of dollars worth of opportunity costs dissapearing with each passing year. It begins where most people begin, with the present value of some certain future sum. Whether it’s a lump-sum pension offer or the price of a bond, this is common ground. You input your desired rate of return, how many years from now you’ll receive the money, and what that money will be. Then the calculator spits out the answer: What is this money really worth today?
PV = FV / (1 + r)^n
Here’s an example: Someone says they’ll pay you $10,000 in five years’ time. Your hurdle rate is 5%. Anywhere above $7,835 is a loss of purchasing power; anywhere below is a return lower than your goal. It’s a neat dividing point between a losing proposition and a sweet deal.
Occasionally you’ll be in the reverse scenario: What’s the implicit annual rate? In other words, what are you paying today and what will you receive later? Simply use this mode of the calculator to plug in what you know, the r. And it rearranges algebra to spit out if the asset meets your hurdle rate. This is especially useful when trying to compare two seemingly similar investments whose inner workings differ. Once marketing language is stripped away, one comparable percentage remains.
The second wrinkle is compounding frequency. In reality, interest doesn’t compound only once per year. If your payment schedule is monthly, quarterly, or semi-annually, then the effective annual rate is a bit higher than the nominal rate. You’ll get something like 12.68% if you take 12% and compound it monthly (which is much higher than 12%). By allowing you to choose the compounding period, the calculator includes this, so that its discount factor matches reality. Tiny changes in the rate will have large effects over long periods. So that little difference does matter if you’re discounting cash flows way into the future.
In practice, it comes down to choosing the proper discount rate, where theory and action collide. For a secure asset (such as Treasury bonds), you can choose a discount rate with minimal risk: say, a 3%; 5% discount rate. When considering riskier bets, however, you’ll need a much steeper hurdle. Early-stage investments may be seeking more than a 25% return, while corporate initiatives often use a 7%-to-9% weighted average cost of capital. As the tables on the page shows, this choice makes present value very sensitive. That same $10,000 payment five years from now, discounted at a 15% discount rate, is worth only about $4,972 today.
The message here is a harsh one: The value of any opportunity hinges entirely based off your own assessment of its risk. And then there’s that schedule the tool spits out, one year at a time. You see how future certainty turns into present doubt and the discount factor shrinks with every passing year. Future certainty turned into present doubt. Abstract time value becomes concrete numbers, numbers that you could use to haggle over a price, or defend in a meeting. And as you match your discount rate to the real-world risk of that cash flow, you know you’re not valuing distant promises too highly.
The tool doesn’t tell you what to do; but it does make sure the decision is informed by a transparent set of numbers instead of wishful thinking. In the end, understanding the time value of money should of defended your capital against the slow decay of delay.