Future Value With Inflation Calculator
See what your money truly becomes. Enter a starting amount, an optional monthly or annual contribution, your growth rate, an inflation rate, and a time horizon. This tool shows the nominal future value from PV(1+r)^n plus contributions, then the inflation-adjusted real value from FV / (1+i)^n and the Fisher real rate, so you can measure the erosion of purchasing power side by side.
🎯Real Money Growth Presets
📝Your Money and Time Inputs
The lump sum you have invested today.
Amount you add each period, set 0 if none.
How often you make each contribution.
How often growth is added to the balance.
Annual rate before inflation, e.g. 7 percent.
Expected average annual inflation, e.g. 3 percent.
Your investing time horizon in years.
Controls rounding on the money cards.
🔢Formula Snapshot
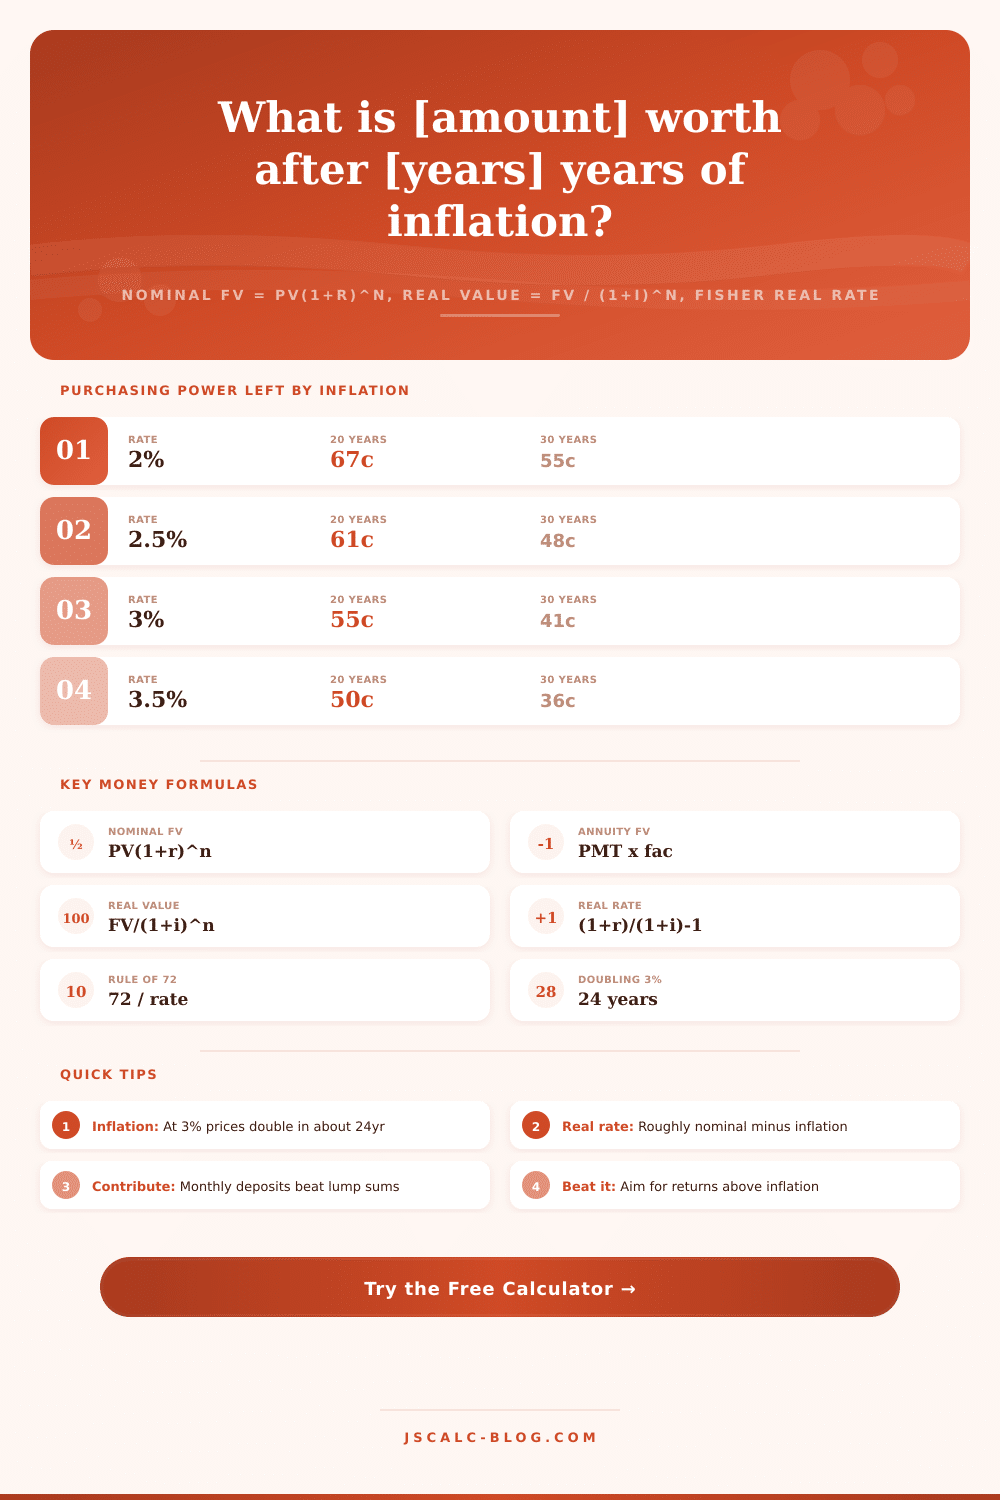
📊Purchasing Power Left After Inflation
| Inflation Rate | After 10 Years | After 20 Years | After 30 Years |
|---|---|---|---|
| 2% | $0.82 | $0.67 | $0.55 |
| 2.5% | $0.78 | $0.61 | $0.48 |
| 3% | $0.74 | $0.55 | $0.41 |
| 3.5% | $0.71 | $0.50 | $0.36 |
| 4% | $0.68 | $0.46 | $0.31 |
| 5% | $0.61 | $0.38 | $0.23 |
| 6% | $0.56 | $0.31 | $0.17 |
| 8% | $0.46 | $0.21 | $0.10 |
⏳Rule of 72: Years to Double
| Annual Rate | Rule of 72 Estimate | Exact Years to Double | Applies To |
|---|---|---|---|
| 2% | 36.0 years | 35.0 years | Slow inflation |
| 3% | 24.0 years | 23.4 years | Typical inflation |
| 4% | 18.0 years | 17.7 years | Elevated inflation |
| 6% | 12.0 years | 11.9 years | Balanced returns |
| 7% | 10.3 years | 10.2 years | Stock market average |
| 8% | 9.0 years | 9.0 years | Aggressive growth |
| 10% | 7.2 years | 7.3 years | High return goal |
| 12% | 6.0 years | 6.1 years | Very aggressive |
📈Nominal vs Real Return Examples
| Nominal Return | Inflation | Rough Real (Subtract) | Exact Real (Fisher) |
|---|---|---|---|
| 5% | 3% | 2.00% | 1.94% |
| 7% | 3% | 4.00% | 3.88% |
| 8% | 4% | 4.00% | 3.85% |
| 10% | 3% | 7.00% | 6.80% |
| 4% | 5% | -1.00% | -0.95% |
| 6% | 2% | 4.00% | 3.92% |
| 3% | 3% | 0.00% | 0.00% |
| 12% | 6% | 6.00% | 5.66% |
🗃Growth Over Time Comparison Grid
| Years | Nominal FV | Real FV | Purchasing Power | Power Lost | Real Growth |
|---|---|---|---|---|---|
| 5 | $14,026 | $12,099 | 86.3% | $1,927 | 21.0% |
| 10 | $19,672 | $14,638 | 74.4% | $5,034 | 46.4% |
| 15 | $27,590 | $17,710 | 64.2% | $9,880 | 77.1% |
| 20 | $38,697 | $21,425 | 55.4% | $17,272 | 114.3% |
| 25 | $54,274 | $25,921 | 47.8% | $28,353 | 159.2% |
| 30 | $76,123 | $31,359 | 41.2% | $44,764 | 213.6% |
| 35 | $106,766 | $37,939 | 35.5% | $68,827 | 279.4% |
| 40 | $149,745 | $45,900 | 30.7% | $103,845 | 359.0% |
Example grid: $10,000 lump sum, 7% nominal growth, 3% inflation, no contributions. Your live results above use your own inputs.
🏦Historical Inflation Averages
| Period | Average Inflation | $1 Falls To | Context |
|---|---|---|---|
| Long-run 100yr | ~3.0% per year | Halves in ~24yr | Broad benchmark |
| 1970s decade | ~7.1% per year | Halves in ~10yr | Oil shock era |
| 1980s decade | ~5.6% per year | Halves in ~13yr | Cooling from peak |
| 1990s decade | ~3.0% per year | Halves in ~24yr | Stable growth |
| 2000s decade | ~2.5% per year | Halves in ~28yr | Low and steady |
| 2010s decade | ~1.8% per year | Halves in ~39yr | Very low inflation |
⚙Formula Breakdown
💡Inflation and Real Return Tips
The trouble is, most of us are used to seeing our bank balance go up (and feeling happy about it). That’s why the number on the screen seem like progress; it’s nominal, meaning that it doesn’t take into account inflation. Even a big pile of money in the future won’t make you richer in real terms if prices has increased more rapidly than your rate of return: you must understand both the amount of money you’ll have and what it’ll be able to buy you.
The calculator above does all the maths for you: it separates the headline figure from its purchasing power so that you never confuse a higher number with actual wealth. Nominal value is raw value, like the number of dollars you see on your statement. It’s called “nominal” because it is the raw dollar amount printed on a statement. Real: Real value is what those dollars are worth after adjusting for rising prices. If your balance triples over three decades but the cost of living double during that time, a big portion of that increase wasn’t realy growth. It was simply inflation boosting both your account and all price tag along with it.
Nominal vs Real Value: Why Inflation Matters
People tend to get this wrong, falling into the trap of judging progress based off the number of dollars alone (which is a misleading measure). That’s the starting point for the core math: the future value formula. Your current value times the growth rate, compounded over time. Leave a lump sum in there, and it grows steadily on its own. But few investors simply drop one deposit into their account and let it sit. They keep adding money at regular intervals forming a stream of deposits that becomes known as an annuity. Each month’s deposit compounds for as long as it sits before your next deposit. And early deposits work harder than later ones; they accrue interest for longer, for more years.
The tool adds the annuity future value to the initial lump-sum future value to produce one combined nominal total. Ordinary calculators don’t do this. They only show your nominal sum which isn’t the true value, that requires deflating the figure, dividing it by inflation raised to the power of the time horizon. If inflation is 3% for 30 years, prices have more than doubled. That big number you see on paper has lost a lot of its value when measured in purchasing power today. Your statement will still read “that big number,” but you won’t be able to get as much for it.
This gap, seen with fresh eyes, is often the wake-up call, since it changes the size of your savings requirement to reach a target stated in today’s prices. The common way people eyeball real return is to just take the nominal rate and subtract out inflation, four percent (seven percent (three percent)). That’s not quite right; the precise calculation use the Fisher equation, which is one divided by the product of (one plus the inflation rate) and (one plus the nominal rate). For seven percent growth and three percent inflation, that works out to roughly 3.88 percent. In any given year, the discrepancy seems small, but it adds up to a lot over decades. The calculator gives you the precise Fisher real rate so your projections aren’t based on a rounding error or a rule of thumb.
Finally, the most sobering number is the purchasing power lost. It’s just the difference between the two values, nominal vs real future value, and it’s the dollars inflation steals from you, dollar after quiet dollar, even while your balance increase. This table extends the concept into typical rates, see how rapidly buying power evaporates with higher inflation.
The takeaway: Plan in real terms, and target a return comfortabley ahead of whatever inflation you expect, since matching inflation in nominal returns puts you right back where you started. When prices rise but cash earns little, you lose value year after year in real terms. This tool shows you both sides, turning an abstract worry into concrete numbers you can act on, ensuring your shadow grows as fast as the runner.