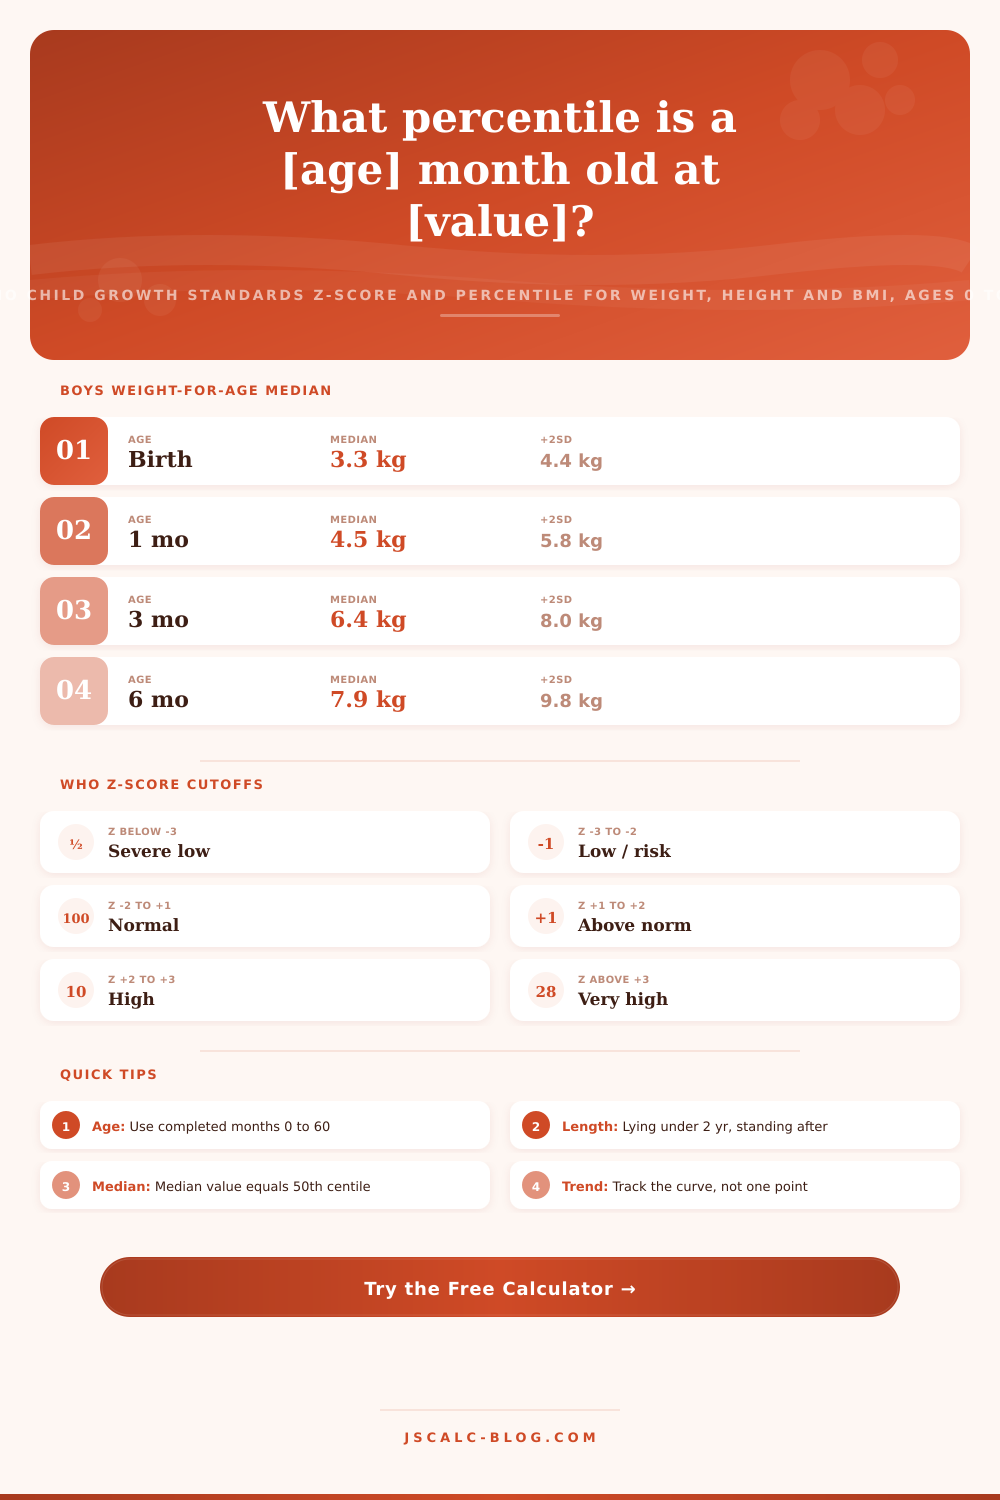
WHO Percentile Calculator for Child Growth (0-5 Years)
Find where a child sits on the WHO Child Growth Standards from birth to 60 months. Choose weight-for-age, length or height-for-age, or BMI-for-age, then enter the age, sex and measured value to get the exact z-score, the percentile, and the WHO interpretation category using stored L, M and S reference values.
🌐Choose a Growth Metric
🎯Real Growth Check Presets
📝Child Measurement Inputs
Selects which WHO L, M and S table is used.
WHO standards use separate boy and girl curves.
Enter 0 to 60 months. Values snap to the WHO grid.
Body weight of the child.
Used for weight and for BMI weight input.
Used for length or height, and for BMI height.
Only used in BMI-for-age mode to derive BMI.
Controls rounding on the z-score and percentile.
🔢Formula Snapshot
📊WHO Z-Score Cutoffs and Meaning
| Z-score Band | Approx Percentile | Weight-for-age | Length / Height-for-age | BMI-for-age |
|---|---|---|---|---|
| Below -3 SD | Below 0.1 | Severely underweight | Severely stunted | Severely wasted |
| -3 to -2 SD | 0.1 to 2.3 | Underweight | Stunted (short) | Wasted (thin) |
| -2 to -1 SD | 2.3 to 15.9 | Low-normal | Low-normal | Low-normal |
| -1 to +1 SD | 15.9 to 84.1 | Normal | Normal | Normal |
| +1 to +2 SD | 84.1 to 97.7 | High-normal | Tall-normal | Possible risk of overweight |
| +2 to +3 SD | 97.7 to 99.9 | Weight high for age | Very tall | Overweight |
| Above +3 SD | Above 99.9 | Very high | Very tall | Obese |
⚖WHO Median Weight-for-Age by Month
| Age | Boy Median | Boy -2SD | Girl Median | Girl -2SD |
|---|---|---|---|---|
| Birth | 3.3 kg | 2.5 kg | 3.2 kg | 2.4 kg |
| 1 month | 4.5 kg | 3.4 kg | 4.2 kg | 3.2 kg |
| 3 months | 6.4 kg | 5.1 kg | 5.8 kg | 4.5 kg |
| 6 months | 7.9 kg | 6.4 kg | 7.3 kg | 5.7 kg |
| 12 months | 9.6 kg | 7.7 kg | 8.9 kg | 7.0 kg |
| 24 months | 12.2 kg | 9.7 kg | 11.5 kg | 9.0 kg |
| 36 months | 14.3 kg | 11.3 kg | 13.9 kg | 10.8 kg |
| 60 months | 18.3 kg | 14.1 kg | 18.2 kg | 13.7 kg |
📏Unit Conversions for Inputs
| From | To | Multiply By | Example |
|---|---|---|---|
| 1 lb | kg | 0.453592 | 15 lb = 6.80 kg |
| 1 kg | lb | 2.204623 | 9.6 kg = 21.2 lb |
| 1 in | cm | 2.54 | 34 in = 86.4 cm |
| 1 cm | in | 0.393701 | 87 cm = 34.3 in |
| 1 cm | m | 0.01 | 87 cm = 0.87 m |
| BMI | kg/m2 | weight / height^2 | 9.6 / 0.87^2 = 12.7 |
🗃Boys Weight-for-Age Comparison Grid
| Age (months) | -3SD | -2SD | Median (50th) | +2SD | +3SD |
|---|---|---|---|---|---|
| 0 (birth) | 2.1 kg | 2.5 kg | 3.3 kg | 4.4 kg | 5.0 kg |
| 2 | 3.8 kg | 4.3 kg | 5.6 kg | 7.1 kg | 8.0 kg |
| 4 | 4.9 kg | 5.6 kg | 7.0 kg | 8.7 kg | 9.7 kg |
| 6 | 5.7 kg | 6.4 kg | 7.9 kg | 9.8 kg | 10.9 kg |
| 9 | 6.4 kg | 7.1 kg | 8.9 kg | 11.0 kg | 12.3 kg |
| 12 | 6.9 kg | 7.7 kg | 9.6 kg | 12.0 kg | 13.3 kg |
| 18 | 7.8 kg | 8.8 kg | 10.9 kg | 13.7 kg | 15.3 kg |
| 24 | 8.6 kg | 9.7 kg | 12.2 kg | 15.3 kg | 17.1 kg |
| 36 | 10.0 kg | 11.3 kg | 14.3 kg | 18.3 kg | 20.7 kg |
| 60 | 12.7 kg | 14.1 kg | 18.3 kg | 24.2 kg | 27.9 kg |
⚙How the Percentile Is Computed
💡Reading WHO Growth Results
ℹEducational Note
It is the scale. That’s where you begin. There is a number. Maybe it’s low. Maybe it’s high. So you check growth charts. Are your kids okay? Does this make sense? This takes away the guessing.
Based off World Health Organization standards, it converts your child’s length or weight into a z-score and percentile. It covers ages from birth to sixty months. Instead of guessing what your kid should be doing, it provides a precise snapshot to help you ask better questions.
How to Use the Growth Calculator
But where do they get their standards? Simply put, researchers followed healthy, breastfed babies across six countries between 1997 and 2003. From this, they developed growth curves that depict how an infant should grow given favorable conditions. The research was rigorous enough that the world now uses these benchmarks as its standard.
The calculator relies on the exact same reference values. Specifically, it has information regarding weight-for-age, length-for-age, height-for-age and BMI-for-age. It separate this data out by sex. It depends on your metric.
Starting with weight-for-age is popular, as that indicates whether the child is heavy or underweight. But by itself, this may not be right. A baby could be heavier (but not overweight) due to her tall stature. Or she could be lighter (but not malnourished) because she’s short.
For stunting, use length/height-for-age. That reveals how well-nourished the child has been over time. It is not necessarily in the moment. Use BMI-for-age to see if there is an early risk of being overweight or “wasting.” This gives a better idea about body composition. And here: changing the metric also means changing the reference table. Instead of putting all our eggs in one number basket, we can look at the child’s growth from multiple angles.
It’s easy enough to enter your data (as long as you do it right). Age is entered in complete months. Sex is selected. Measured value is typed in. Units will get converted internally. Regardless of what you enter, all math uses standard metric values. In BMI mode, there’s also a height field that calculates the index first.
There are presets which demonstrate mapping of values to the curves. For instance, a boy who is twelve months old and weighs nine point six kilograms is at the median. This helps you see where your measurements sits without needing to perform any complex math yourselves.
These percentiles aren’t straightforward math. Percentile growth is naturaly skewed. That means a straight average would misplace many children. The World Health Organization (WHO) employs the LMS method. This accounts for the median, skewness and variation across all ages. Then the z-score is calculated using a formula. It adjusts for that skew. If L gets close to zero, then it changes to log-normal. This keeps extreme values where they belong on the curve. Again, this is a little technical detail but it’s what makes the results reliable.
Percentiles are more accessible to most. Z-scores are expressed as number of standard deviations from the median. 0 on the z-score corresponds to the fiftieth percentile. -2 on the z-score corresponds to about the second percentile. This corresponds to clinical cutpoints used to flag children at risk. Below -2 standard deviation on weight-for-age marks a child as underweight. Below -2 standard deviation on height-for-age marks a child as stunted.
The labels turn this information into plain language. The labels help you understand if a value is normal, high-risk or an outlier. The percentile at one point in time is not the full picture. One percentile is only a moment in time. Lower centile kids can follow right along and be fine. It’s the trendline over time. Typically, if your child is following the fifteenth percentile continuously, they’re doing great. If you see a precipitous decline across two major bands, pay attention.
How you measure is critical as well. Before age two, length is taken lying down. Afterward height is taken while standing. Chasing any particular number is less important then consistent measurement methods. Additional information is available in reference tables on the page. For example, there are charts of median weights and z-score bands by month for each sex. You can use them to sanity-check your results or understand where certain cutoffs sits relative to the average. It helps you see where the cutoffs fall compared to the mean.
This isn’t a diagnostic device, but an aid for learning. It’s a tool that will make it easier to frame good questions when you visit the doctor with your kid. A number that worries you still calls for a visit from a health professional who can assess the kids history and overall development. Early care can benefit from growth monitoring.
The math here is tricky to do by hand. This calculator simplifies the LMS calculations. It takes the raw measurement and converts it to something you can interpret immediately. This helps parents not get lost in the numbers so they can see what is going on with their childs growth over time.
The whole purpose isn’t to hit a number. The purpose is to know that they’re on track for good health. Not one point fixes it. But if your little one is on a healthy growth path, then we want to look at the curve.