Sales Profit Margin Calculator
Turn revenue and cost of goods sold into gross profit, gross margin percent, and markup percent, see clearly why margin and markup are not the same number, add operating expenses for a net margin, and reverse the math to find the selling price that hits any target margin.
💰How Do You Want to Enter Sales?
🎯Real Industry Margin Presets
📝Sales & Cost Inputs
Money received from the sale before any costs.
Direct cost to make or buy what you sold.
Price charged to the customer for one unit.
Your direct cost to supply one unit.
Number of units in this sales batch.
Rent, wages, ads and overhead for a net margin.
The margin you want; we solve the price to reach it.
Controls dollars and percents on every card.
🔢Formula Snapshot
📊Margin vs Markup at a Glance
| Concept | Formula | Base It Is Measured Against | Example on R=100, C=60 |
|---|---|---|---|
| Gross profit | Revenue − COGS | Dollars, not a percent | 100 − 60 = $40 |
| Gross margin | (R − C) / R × 100 | Percent of selling price | 40 / 100 = 40% |
| Markup | (R − C) / C × 100 | Percent of cost | 40 / 60 = 66.67% |
| Net margin | (R − C − OpEx) / R × 100 | Percent of revenue | after overhead |
| Price for margin | C / (1 − m/100) | Dollars from cost | 60 / 0.55 = $109.09 |
📋Typical Gross Margins by Industry
| Industry | Typical Gross Margin | Equivalent Markup | Note |
|---|---|---|---|
| Software / SaaS | 75% to 85% | 300% to 567% | Low unit cost to serve |
| Professional services | 50% to 70% | 100% to 233% | Labor is the main cost |
| Jewelry & luxury | 50% to 65% | 100% to 186% | Brand and design premium |
| Restaurants (food) | 60% to 70% | 150% to 233% | Food cost near 30% |
| Apparel & retail | 40% to 60% | 67% to 150% | Keystone is 50% margin |
| Grocery | 20% to 30% | 25% to 43% | High volume, thin margin |
| Consumer electronics | 8% to 20% | 9% to 25% | Very competitive pricing |
🏷Target-Margin Pricing on a $60 Cost
| Target Margin | Divisor (1 − m) | Required Price | Gross Profit | Equivalent Markup |
|---|---|---|---|---|
| 10% | 0.90 | $66.67 | $6.67 | 11.1% |
| 20% | 0.80 | $75.00 | $15.00 | 25.0% |
| 30% | 0.70 | $85.71 | $25.71 | 42.9% |
| 40% | 0.60 | $100.00 | $40.00 | 66.7% |
| 45% | 0.55 | $109.09 | $49.09 | 81.8% |
| 50% | 0.50 | $120.00 | $60.00 | 100.0% |
| 60% | 0.40 | $150.00 | $90.00 | 150.0% |
| 70% | 0.30 | $200.00 | $140.00 | 233.3% |
🗃Markup to Margin Conversion Grid
| Markup % | Equivalent Margin % | Cost Example | Selling Price | Gross Profit $ | Profit per $100 Sales |
|---|---|---|---|---|---|
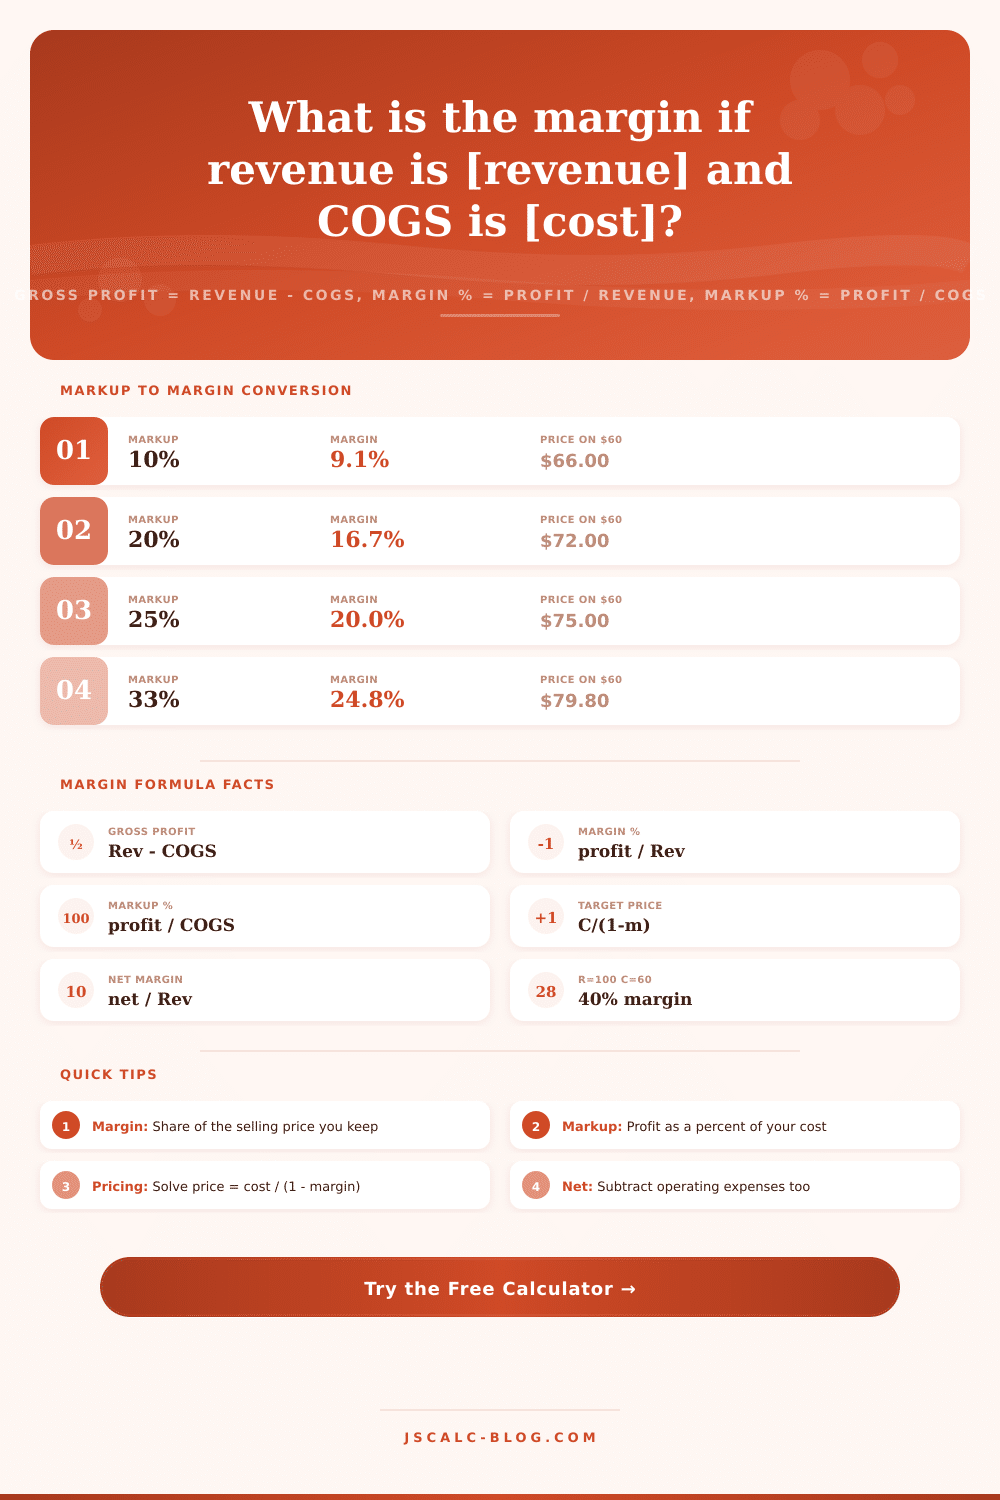
| 10% | 9.09% | $60.00 | $66.00 | $6.00 | $9.09 |
| 20% | 16.67% | $60.00 | $72.00 | $12.00 | $16.67 |
| 25% | 20.00% | $60.00 | $75.00 | $15.00 | $20.00 |
| 33.33% | 25.00% | $60.00 | $80.00 | $20.00 | $25.00 |
| 50% | 33.33% | $60.00 | $90.00 | $30.00 | $33.33 |
| 66.67% | 40.00% | $60.00 | $100.00 | $40.00 | $40.00 |
| 100% | 50.00% | $60.00 | $120.00 | $60.00 | $50.00 |
| 150% | 60.00% | $60.00 | $150.00 | $90.00 | $60.00 |
| 200% | 66.67% | $60.00 | $180.00 | $120.00 | $66.67 |
| 300% | 75.00% | $60.00 | $240.00 | $180.00 | $75.00 |
⚙Formula Breakdown
💡Pricing & Profit Tips
If you’re seeing those sales numbers rolling in, but you’re still out of money come the end of the month there’s a certain type of financial whiplash going on. And it typically stems from this: mixing up markup and margin. While they might sound like synonymous words in everyday conversation, they aren’t. In accounting, they’re two distinct word with differing consequences for whether or not you make it to the next month.
Enter the handy-dandy calculator above. It takes all that revenue and cost of goods sold and spits out a markup figure (along with the margin percentage) so you’ll know exactly what’s wrong.
Markup and Margin Are Not the Same
Until numbers scream it at you, most of us believe these words is interchangeable. It is simple. What did you spend to acquire or make the thing? Subtract that from what you recieve when you sold the thing. That’s your gross profit. You bought something for $60. You sold it for $100. Your gross profit is $40.
Gross margin uses the $40 to show what percentage of total selling price was made. In our example, it is 40%. So out of each sales dollar, you have forty cents left once you cover the direct cost of making or acquiring an item. That means you know how viable a product are. Dividing by the selling price (the numerator) lets you compare items at different prices fairly.
That’s the issue with markup. Whereas margin calculates that same $40 in profit as a percentage of cost, markup does so as a percentage of revenue. It goes from forty percent to sixty-six point six seven percent. It is the same number of dollars. It is a completely different view of world. What appears as a fifty percent markup is really just a thirty-three point three percent margin.
You’ll always think you’ve got plenty more to spend when you price for markup and assess financial health with margin metrics. That’s the space where cash flow dissapears quietly with everyone smiling at the top line.
That means, too often, we work backwards (from a desired price) instead of forwards (from a cost). We think about how much margin we want, enough to pay our bills and leave some left over, of course! And we solve for it. To do this the tool applies following formula: Cost / (1… TargetMarginPercentage)
So if your cost is sixty dollars and you need a margin of forty-five percent, you don’t just tack on forty-five percent and come up with a price of eighty-seven dollars. That leaves you with smaller actual margin. No, you have to divide sixty by zero point five five to get one hundred and nine dollars and nine cents. It is easy to add, but it is wrong. It is precise when you divides.
It seems obvious when you look at this stuff, but it’s important to draw this distinction between margin and markup in all sorts of businesses. After all, grocery stores have razor-thin margins, they make up for low individual item profits by selling in high volume. On the other hand, software businesses can afford to increase prices by 100%. That sounds pretty aggressive, but check out the reference tables below. They can do this as long as their unit cost were close to nothing after development.
That said, retailers who double the cost price (known as “keystoning”) also gets a nice 50% margin, which is the same result than a 100% markup. Knowing your starting point helps you understand your suppliers without any awkwardness and report to your investors clearly. Knowing your starting point helps you understand your suppliers without any awkwardness and report to your investors clearly.
To drill down further, you can enter operating expenses, too, your advertising spend, wages, and rent, and then look at net margin, meaning gross profit minus those operating expenses. That’s as close to a true measure of profitability as possible. If you leave that field empty, it’s about pure product economics; if you fill it out, it shows you whether business is viable when the lights come on. By presetting the fields with common assumptions (e.g., for an e-commerce store or restaurant) you can play around with the numbers easily, without having to start from zero. It makes the percentages into real price point.
The takeaway? Numbers aren’t for memorization; they’re for comprehension. Your margin tells you which light switch turns off the lights. Your markup enables you to haggle with a supplier who thinks in cost-plus. The calculator joins them both, bridging that gap between your two realities. If you can see clearly exactly how much of every dollar you keep vs how much you send right back out again, then you don’t guess (you manage). That’s priceless knowledge, regardless of whatever one or two percentage points it delivers.