Net Profit Margin Calculator
Build the full profit waterfall from total revenue down to the bottom line. Subtract cost of goods sold, operating expenses, interest and taxes, add any other income, and read gross, operating and net margin percentages so you can see exactly where the money goes.
🎯Real Business Presets
📝Income Statement Inputs
All net sales for the period, before any costs.
Direct cost of the products or services sold.
Selling, general and admin, rent, salaries, marketing.
Interest paid on loans, credit lines and debt.
Corporate income tax owed on the profit.
Interest earned, one-off gains; added back to profit.
Display only; does not change the math.
Controls rounding on every margin percentage.
🔢Formula Snapshot
📈Typical Net Margins by Industry
| Industry | Typical Net Margin | Margin Profile | Why |
|---|---|---|---|
| Software / SaaS | 15% to 25% | High | Low COGS, scalable code |
| Banks & finance | 20% to 30% | High | Fee and interest spread |
| Pharmaceuticals | 15% to 20% | High | Patents, pricing power |
| Consulting services | 10% to 18% | Medium | People cost heavy |
| Manufacturing | 5% to 12% | Medium | Materials and plant cost |
| Retail (general) | 2% to 5% | Low | Volume, price competition |
| Restaurants | 3% to 6% | Low | Labor and food waste |
| Grocery stores | 1% to 3% | Thin | Razor-thin, high turnover |
📊Gross vs Operating vs Net Margin
| Margin Level | Formula | Costs Removed | What It Shows |
|---|---|---|---|
| Gross margin | (Rev − COGS) / Rev | COGS only | Product profitability |
| Operating margin | (Gross − Opex) / Rev | COGS + SG&A | Core operating efficiency |
| Pretax margin | (Op + Other − Int) / Rev | Above + interest | Profit before tax |
| Net margin | Net income / Rev | Every expense | True bottom line |
🌡Net Margin Health Benchmarks
| Net Margin | Rating | Read | Action |
|---|---|---|---|
| Below 0% | Loss | Spending exceeds sales | Cut costs or raise price |
| 0% to 5% | Thin | Fragile, little cushion | Guard fixed costs |
| 5% to 10% | Average | Healthy for many sectors | Protect and grow |
| 10% to 20% | Strong | Efficient operation | Reinvest surplus |
| Above 20% | Excellent | High pricing power | Defend the moat |
🗃Industry Margin Comparison Grid
| Industry | Gross % | Operating % | Net % | Cost Driver | Notes |
|---|---|---|---|---|---|
| SaaS / software | 80% | 20% | 18% | R&D, sales | Scales with users |
| Pharmaceuticals | 70% | 25% | 18% | Research | Patent protected |
| Marketing agency | 55% | 18% | 12% | Salaries | People-driven |
| Manufacturing | 30% | 12% | 8% | Materials | Capital heavy |
| Construction | 20% | 8% | 5% | Labor, materials | Project cycles |
| Ecommerce brand | 45% | 10% | 6% | Ads, shipping | Ad spend sensitive |
| Restaurant | 65% | 9% | 5% | Food, labor | Rent pressure |
| Retail chain | 35% | 7% | 4% | Inventory | Volume game |
| Grocery store | 25% | 3% | 2% | Cost of goods | Thinnest margins |
| Airline | 25% | 8% | 5% | Fuel, fleet | Cyclical |
⚙Formula Breakdown
💡Net Margin Tips
We all know the dreaded question that every business owner has to ask themselves at some point. After costs are accounted for, how much of every dollar in sales ends up in your pocket? Gross margin doesn’t tell the full picture, and revenue certainly doesn’t reveal anything about profits. The real bottom line is net profit margin.
This represent the % of revenue that survives after subtracting cost of goods sold, operating expenses, interest and taxes. This tool breaks down entire waterfall into bite-size chunks so you don’t just end with a number; you know precisely where every penny goes (and leaks) along the way.
How to Calculate Net Profit Margin
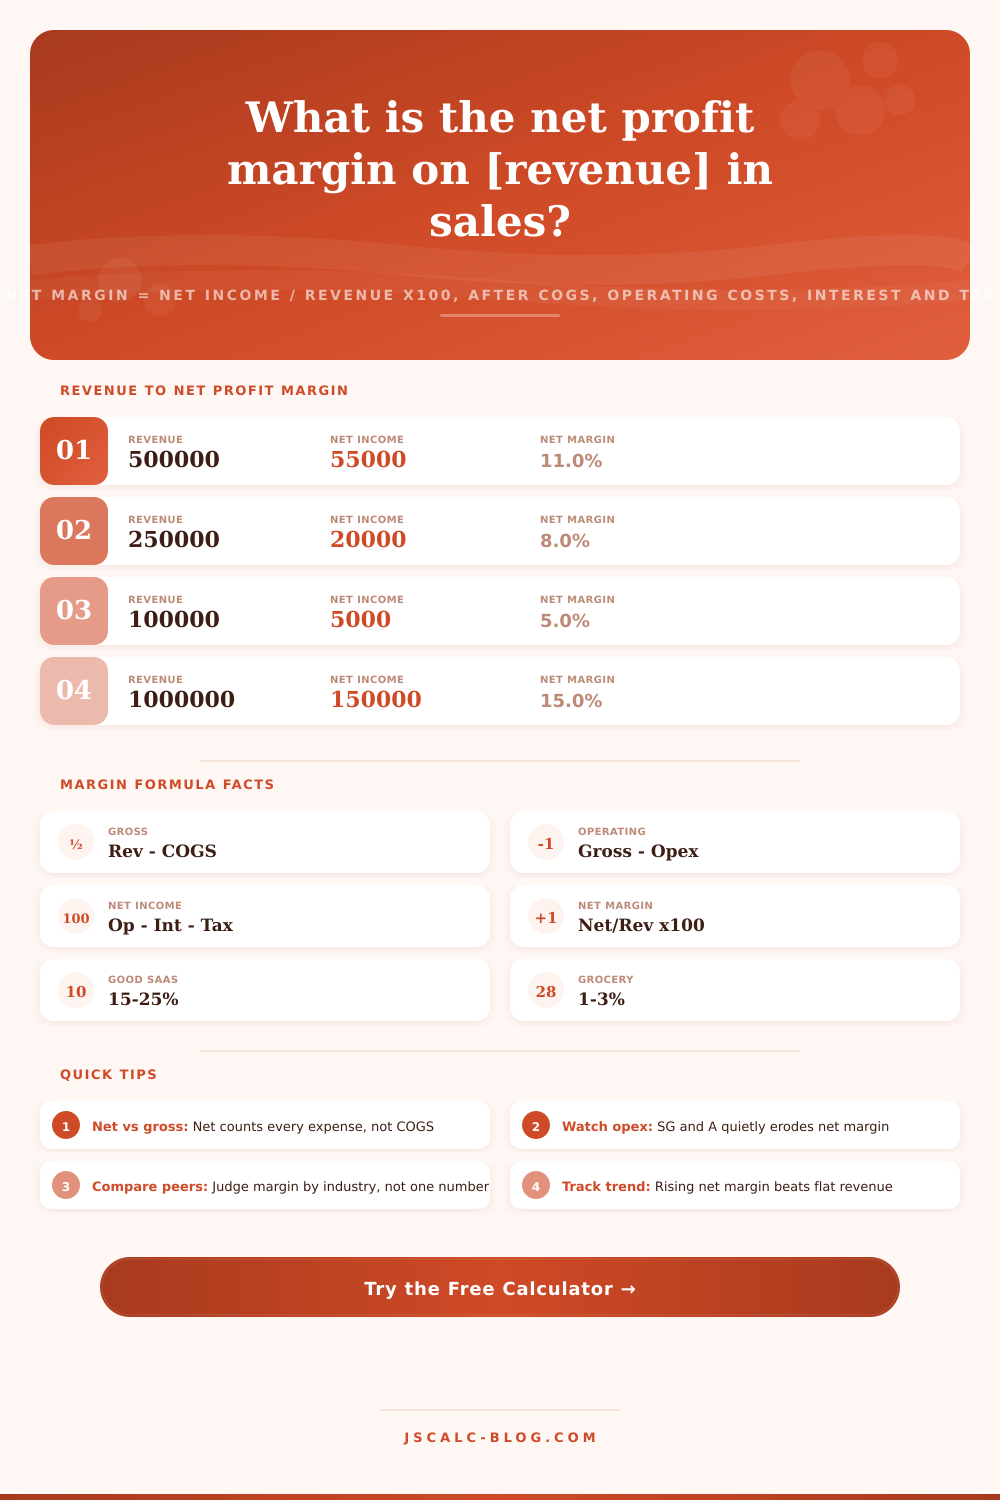
Net profit margin is calculated as net income divided by total revenue, multiplied by 100 to get a percentage. A company has $500,000 in revenue at the end of a period. At the end of the same period, it nets $55,000 in income. The net profit margin is 11 percent. And that one number is a doozie. It includes everything. Every dollar of tax, every dollar of interest on debt, every operating cost. And it shows you if entire business as a system is making any money.
Gross margin only takes into account the direct cost of goods. So it’s not a complete picture. But net margin is. And that’s why so many people make mistake of focusing only on top-line growth. The concept is that profit comes from sequence, not subtraction.
The calculation follows this flow: Total Revenue, Gross Profit, Operating Profit, and Net Income. Gross profit is calculated by subtracting the Cost of Goods Sold (COGS) from revenue. Operating profit is calculated by subtracting the Operating Expenses (selling, general and admin, aka SGA): Rent, Salaries, Marketing etc. Net income is calculated by taking operating profit, adding Other Income, and subtracting Interest & Taxes.
What sets this calculator apart from something as basic as a sales margin calculator? The latter stops at gross. This one shows all three layer simultaneously. They’re simple to calculate, and they have exact formulas: Revenue, COGS = gross profit; gross profit, operating expenses = operating profit; operating profit, interest, taxes + other income = net income.
The margins come from dividing each of those levels of profit by your revenue, multiplying it times 100, and you’re done. Say we had 500,000 in revenue, 300,000 in COGS, 120,000 in operating expenses, 10,000 in interest, and 15,000 in taxes. That’s 200,000 in gross profit, 80,000 in operating profit, and it falls all the way down to 55,000 in net income. Divide 55,000 by 500,000 and boom! There’s our net profit margin, right at 11 percent.
Why does it work? Because it does. The results panel leads with four cards that summarize the entire income statement: Net Profit shows the dollar amount of bottom-line income; Net Profit Margin converts that into a headline percentage; Gross Margin shows pure product profitability; and Operating Margin isolates how efficient core business is before financing and tax.
Below the cards, a full breakdown lays out each line item from the waterfall alongside its own margin percentage. This allows the tool to be read as a compact profit and loss statement that can be scanned within seconds.
There are two other variables that you might not notice but make a big difference in the answer. First is interest expense, which represents the price tag for having debt on your books. Second is other income, such as interest earned, an investment gain, or some other one-off thing not part of routine business operations, which the calculator adds back. Including these two variables means the tool is accurately modeling the gap between operating margin and net margin, which is precisely what banks care about.
The calculator also includes presets drawn from real business models to make the concept concrete. There is a SaaS company with a high gross margin but large operational spend on research and sales. There is a grocery store with razor-thin margins of only one to three percent at high volume. There is a restaurant with large food and labor expenses, and a manufacturer with plant and materials expense. Finally, there is even a loss-making startup where spending outpaces sales, showing what that negative net margin feels like. Load up any of these presets and the form will fill in automatically so you can get an idea of how varying cost structures produce wildly different bottom lines.
That’s why context is important: a net margin is nothing by itself. Four percent net margin is perfectly healthy for a grocery chain, yet alarming for a software firm. The page makes this clear with its reference tables laying out typical net margins across sectors. It also translates those raw numbers into ratings from loss to excellent. So no longer do you have to judge your own number against some abstract ideal; they let you judge it against the right peer group.
And that’s what we mean when we say profit hides in the gap between total sales and net income, because that’s where businesses quietly succeed or fail. This calculator takes a stack of income statement lines and gives you an answer you can act on, whether you’re pricing a product, pitching investors or simply checking the health of your own company. Select from one of their presets (or input your own), let them run through the numbers, follow their breakdown, and then look at the answer versus the benchmarks. In seconds, you’ll have a reliable net margin that will help you know exactly where the money flows (and where it doesn’t).