Head Circumference Percentile Calculator
Estimate an infant or child head circumference percentile from age and sex using WHO and CDC style LMS reference data. Enter the occipitofrontal circumference in centimeters or inches to get the exact z-score, the percentile, the median head size for that age, and a flag for microcephaly below the 3rd percentile or macrocephaly above the 97th.
🎯Quick Example Presets
📝Child Measurement Inputs
Boys and girls use different LMS growth references.
Use 0 for a newborn. Range covered is 0 to 60 months.
Largest occipitofrontal wrap around brow and back of head.
Inches are converted internally with 1 in = 2.54 cm.
Preterm infants should be plotted by corrected age.
Controls rounding on the percentile result cards.
🔢Formula Snapshot
📋Median Head Circumference by Age (50th Percentile)
| Age | Boys 50th (cm) | Boys 50th (in) | Girls 50th (cm) | Girls 50th (in) |
|---|---|---|---|---|
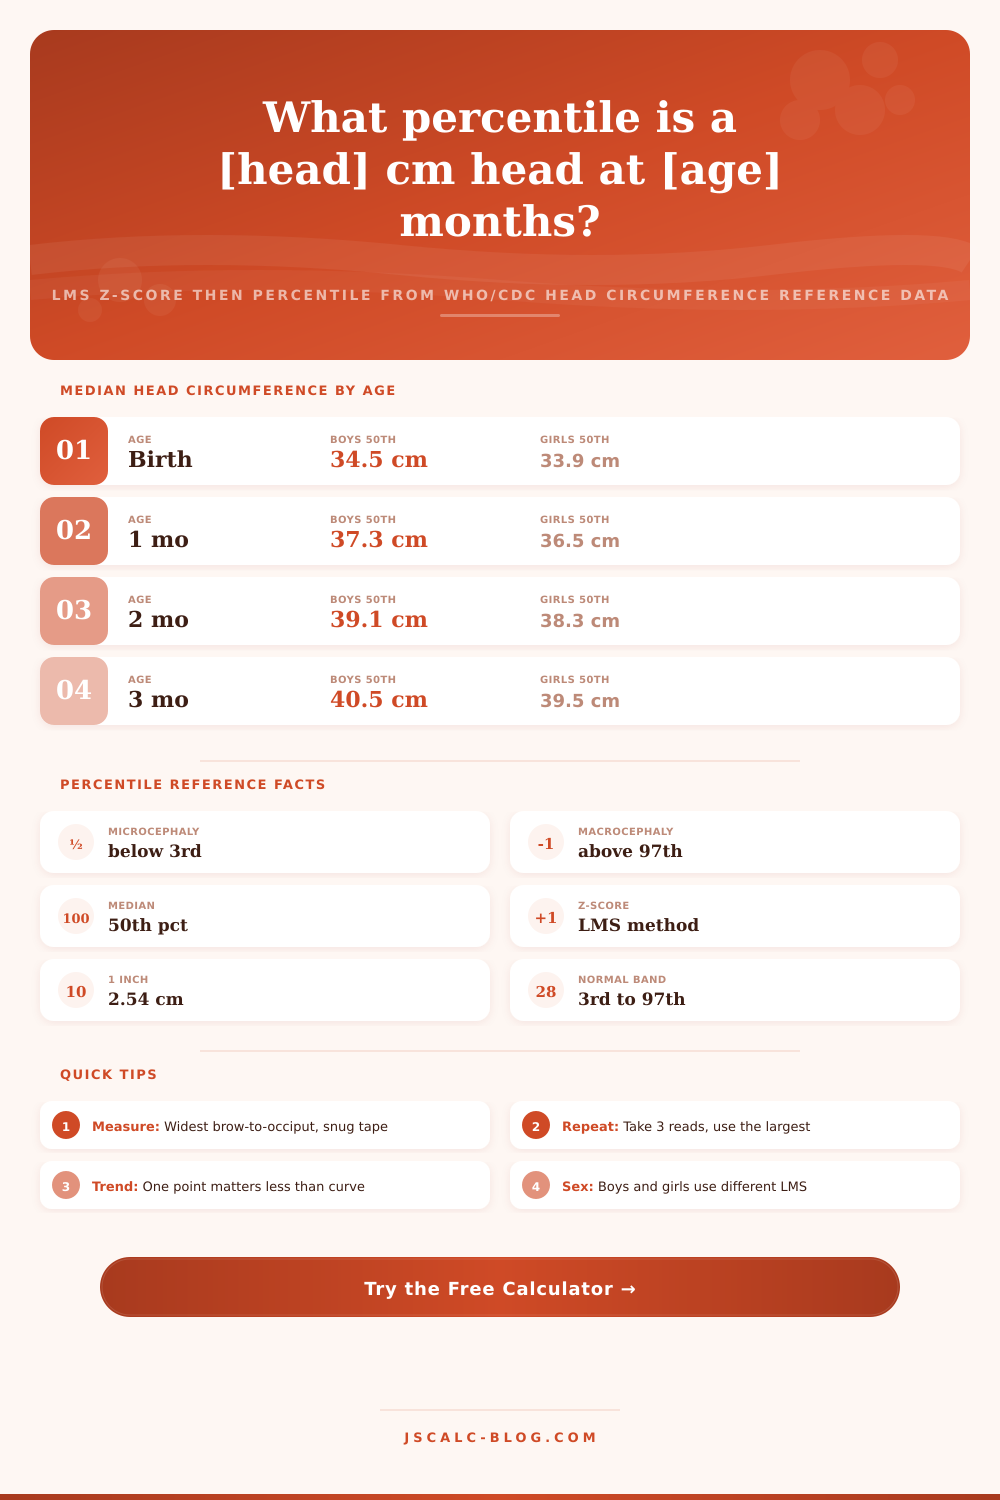
| Birth | 34.5 | 13.6 | 33.9 | 13.3 |
| 1 month | 37.3 | 14.7 | 36.5 | 14.4 |
| 2 months | 39.1 | 15.4 | 38.3 | 15.1 |
| 3 months | 40.5 | 15.9 | 39.5 | 15.6 |
| 6 months | 43.3 | 17.0 | 42.2 | 16.6 |
| 9 months | 45.0 | 17.7 | 43.8 | 17.2 |
| 12 months | 46.1 | 18.1 | 44.9 | 17.7 |
| 18 months | 47.4 | 18.7 | 46.2 | 18.2 |
| 24 months | 48.3 | 19.0 | 47.2 | 18.6 |
| 36 months | 49.5 | 19.5 | 48.5 | 19.1 |
📊Percentile, Z-Score and Status Bands
| Percentile | Approx Z-score | Meaning | Status Flag |
|---|---|---|---|
| Below 3rd | Below -1.88 | Unusually small head | Microcephaly review |
| 3rd | -1.88 | Lower normal edge | Watch and trend |
| 10th | -1.28 | Smaller than average | Normal range |
| 25th | -0.67 | Below middle | Normal range |
| 50th | 0.00 | Exactly typical | Median |
| 75th | +0.67 | Above middle | Normal range |
| 90th | +1.28 | Larger than average | Normal range |
| 97th | +1.88 | Upper normal edge | Watch and trend |
| Above 97th | Above +1.88 | Unusually large head | Macrocephaly review |
📏Centimeter to Inch Conversions
| Centimeters | Inches | Inches | Centimeters |
|---|---|---|---|
| 33 cm | 13.0 in | 13 in | 33.0 cm |
| 35 cm | 13.8 in | 14 in | 35.6 cm |
| 40 cm | 15.7 in | 15 in | 38.1 cm |
| 43 cm | 16.9 in | 16 in | 40.6 cm |
| 46 cm | 18.1 in | 17 in | 43.2 cm |
| 48 cm | 18.9 in | 18 in | 45.7 cm |
| 50 cm | 19.7 in | 19 in | 48.3 cm |
🗃Head Circumference Percentile Comparison Grid
| Age (months) | Boys 3rd (cm) | Boys 50th (cm) | Boys 97th (cm) | Girls 3rd (cm) | Girls 50th (cm) | Girls 97th (cm) |
|---|---|---|---|---|---|---|
| 0 | 32.1 | 34.5 | 37.0 | 31.5 | 33.9 | 36.2 |
| 1 | 34.9 | 37.3 | 39.6 | 34.2 | 36.5 | 38.9 |
| 2 | 36.8 | 39.1 | 41.5 | 35.8 | 38.3 | 40.7 |
| 3 | 38.1 | 40.5 | 42.9 | 37.1 | 39.5 | 42.0 |
| 6 | 41.0 | 43.3 | 45.8 | 39.7 | 42.2 | 44.8 |
| 9 | 42.7 | 45.0 | 47.4 | 41.2 | 43.8 | 46.4 |
| 12 | 43.6 | 46.1 | 48.5 | 42.3 | 44.9 | 47.5 |
| 18 | 44.9 | 47.4 | 49.9 | 43.5 | 46.2 | 48.8 |
| 24 | 45.8 | 48.3 | 50.8 | 44.4 | 47.2 | 49.9 |
| 36 | 47.0 | 49.5 | 52.0 | 45.7 | 48.5 | 51.2 |
⚙Formula Breakdown
💡Measurement and Tracking Tips
⚕Medical and Educational Note
Head circumference is how big your baby’s head is. That’s important for understanding how your little one’s brain is growing early on. To get the measurement, wrap a gentle tape measure around top of your baby’s head, right above his/her eyebrows, and across the bump in the back of skull. Your baby will likely be confused or squirming throughout the whole proces. Alongside length and weight, head circumference is one of the three primary measurements doctors is keeping an eye on.
In the first few years of life, your child’s skull grows with her/his brain. Knowing the size path helps shed some light on healthy growth. This will take into account age, sex, and one measly tape measurement and compare it against other children to indicate where your kid falls on the spectrum. No need to read through a chart of statistics yourself, let it crunch those numbers for you. This is the percentile answer to a ranking question.
How to Measure Your Baby’s Head Size
If you get back a number at the 50th percentile it means your baby’s head size is average for that age and sex. If you get back a 10th percentile score then 90% of children your same sex and age have bigger heads. And if you get a 90th percentile score, it means only 10% of children has bigger heads. Percentile scores aren’t grades. There is no such thing as a failing grade here. Children can stay on the 15th or 85th percentile for years without any problems and still be considered healthy babies.
What clinicians look for is that over time child stays steady along their own curve. It’s the consistency that counts. These calculations are based off the LMS method as opposed to a simple average. For each sex/age group, three values from large health organizations are used to show growth. The L value accounts for skewing due to the fact that heads don’t naturaly form a perfectly shaped bell curve. M stands for median measurement, and S represents the spread of measurements. This is all stored in the reference table and filled in smoothly across months. Instead of having to place a reading into the nearest whole year, a reading at 7 or 15 month can be read with precision.
Flexible modeling are required because growth is messy. Growth is messy. The tool takes your raw size in centimeters and computes a z-score: How far away from the median that size is (in standard deviation units). Then it adjusts that with the L value, which accounts for any skewness in the data. If the L value is effectively zero then it will transform into a logarithm; this prevents math errors. The new form of the function squishes everything together, making it approximately follow a standard normal distribution. Because of that, you can compute a nice percentile that’s not messed up anywhere on the spectrum of sizes.
It is a bit of technical trivia, but it is critical that we get it right at all sizes. After calculating the z-score, we find the percentile. We do this by finding the area underneath the normal distribution from negative infinity to our calculated z-score. This is the part the calculator estimates using a very accurat estimation of this function.
We have some logic in place to sanity check things. Enter in same median head circumference value for your child’s age and the numerator becomes zero. The numerator will be zero. This means that the z-score has to also be zero. And the percentile should spit back exactly 50. That confirms that math is set properly against the reference data. The internal checks confirm the baseline. Trust away.
Two specific thresholds for head size may need further inspection. One is below the 3rd percentile (about a -1.88 z-score), which is flagged as possibly having microcephaly. The other is above the 97th percentile (at about +1.88 z-score), which is flagged as possibly having macrocephaly. The flags aren’t diagnoses in and of themselves, but rather prompts to follow up with an expert. There are plenty of totally healthy kids who fall outside these lines… Particularly when they have similarly large or small headed parents.
It depends on the context. A single outlier point isn’t as helpful as a trend line on a chart. Charts are measured in centimeters whereas parents tend to measure at home in inches. It will accept both units and convert internally with the correct factor (2.54 cm/inch). All results are displayed clearly; no need for anything to get lost in translation.
Heads are usually around thirty-four to thirty-five centimeters long when babies is born and grow to approximately fifty centimeters by the time they’re three. You can also test some realistic scenarios out quickly by using the presets. You get instant feedback. Just one click fills the form in, and it calculates instantly without any manual entry errors.
It’s intended as a learning and approximation tool, not a medical diagnosis tool. It uses estimated values from a compacted reference table, so these are approximate values based on official charts, not exact points plotted. To obtain an accurate representation, input preterm babies in corrected age. If your baby has a sudden jump in head size and crosses over a percentile line between visits, or if any of the values fall out of the normal range, take them to see their pediatric provider. Combined with professional care, it can make the science come to life. It will give you a fast and reliable sense of where your child stands. You should of put the tape measure back around your child’s head and know precisely what that number represents.