Birth Weight Percentile Calculator
Estimate a newborn's birth-weight percentile for gestational age and sex using an LMS z-score in the Fenton and WHO style. Enter weeks of gestation, sex, and weight in grams or pounds and ounces to see the percentile, the z-score, and whether the baby is small, appropriate, or large for gestational age.
⚖Weight Entry Unit
🎯Real Newborn Presets
📝Newborn Inputs
Whole weeks from 24 to 42, using your best dating estimate.
Optional fine tuning, e.g. 39 weeks and 4 days.
Reference LMS values differ by sex.
Measured weight at delivery, 200 to 7000 g.
Whole pounds portion of the weight.
Ounces portion, 0 to 15.9 (16 oz = 1 lb).
Both use the built-in LMS reference; display note only.
Controls the percentile shown on the cards.
🔢Formula Snapshot
📋Median Birth Weight by Gestational Age
| Gestational Age | Boys 50th (g) | Girls 50th (g) | Stage |
|---|---|---|---|
| 24 weeks | 660 g | 630 g | Extremely preterm |
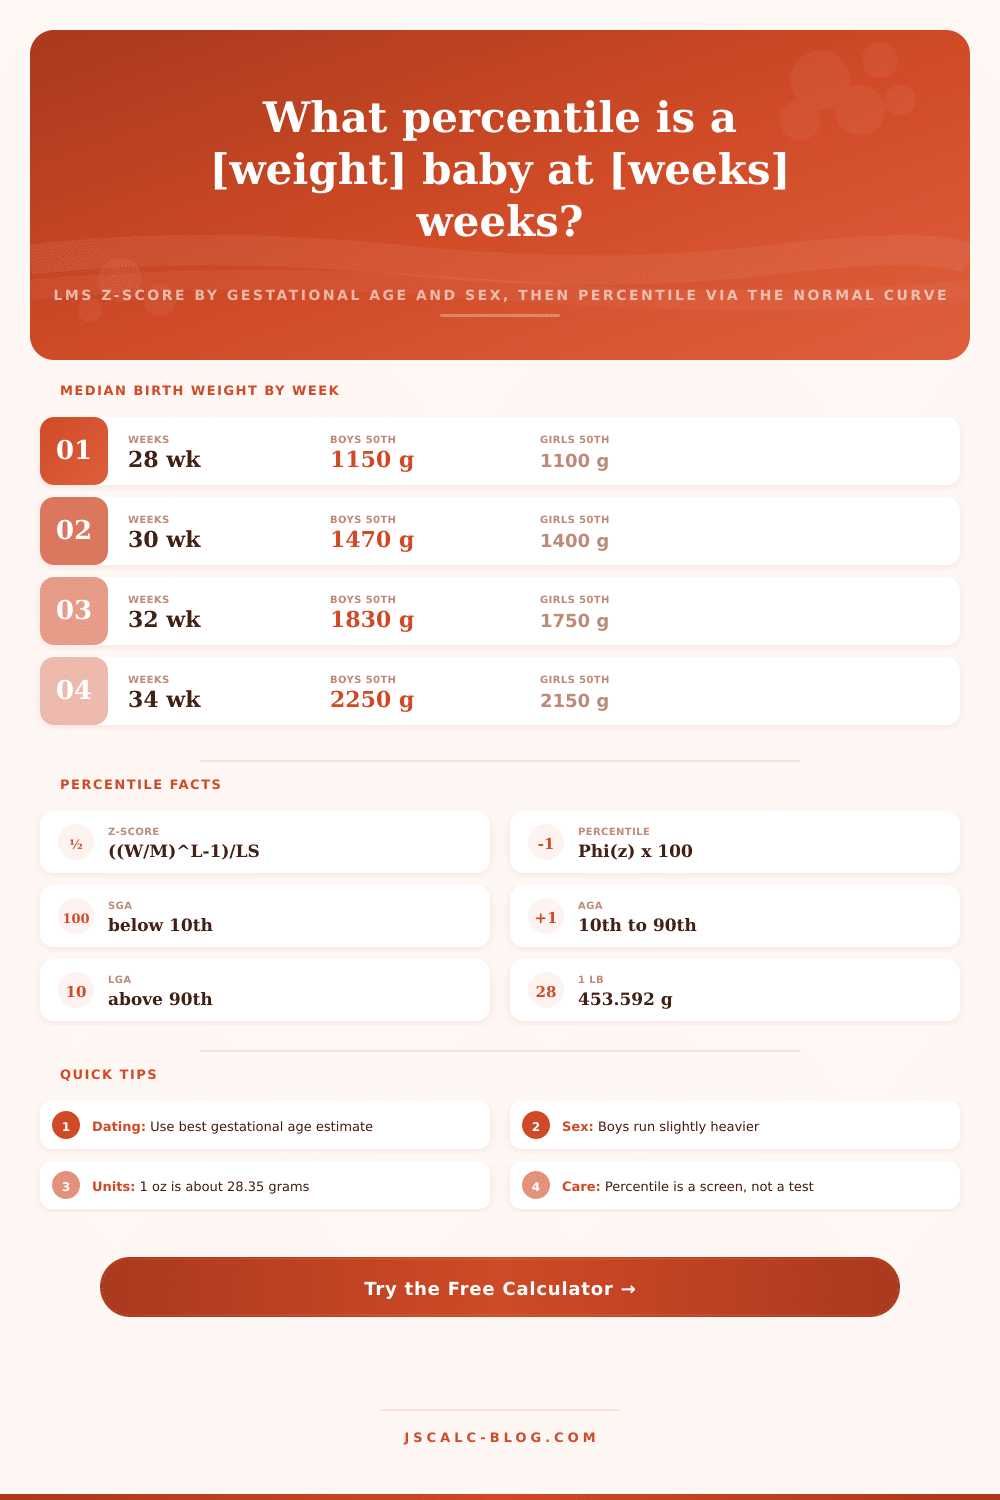
| 28 weeks | 1150 g | 1100 g | Very preterm |
| 30 weeks | 1470 g | 1400 g | Very preterm |
| 32 weeks | 1830 g | 1750 g | Moderate preterm |
| 34 weeks | 2250 g | 2150 g | Late preterm |
| 36 weeks | 2700 g | 2580 g | Late preterm |
| 37 weeks | 2950 g | 2820 g | Early term |
| 38 weeks | 3180 g | 3050 g | Early term |
| 39 weeks | 3400 g | 3270 g | Full term |
| 40 weeks | 3570 g | 3430 g | Full term |
| 41 weeks | 3700 g | 3560 g | Late term |
| 42 weeks | 3780 g | 3640 g | Post term |
📊Percentile Bands and Classification
| Percentile Range | Z-score Range | Class | Meaning |
|---|---|---|---|
| Below 3rd | z < −1.88 | SGA (severe) | Well below expected weight |
| 3rd to under 10th | −1.88 to −1.28 | SGA | Small for gestational age |
| 10th to 50th | −1.28 to 0 | AGA (lower) | Appropriate, below median |
| 50th to 90th | 0 to 1.28 | AGA (upper) | Appropriate, above median |
| Over 90th to 97th | 1.28 to 1.88 | LGA | Large for gestational age |
| Above 97th | z > 1.88 | LGA (severe) | Well above expected weight |
📏Grams to Pounds and Ounces Conversions
| Grams | Kilograms | Pounds + Ounces | Note |
|---|---|---|---|
| 1000 g | 1.00 kg | 2 lb 3 oz | Very low birth weight |
| 1500 g | 1.50 kg | 3 lb 5 oz | Low birth weight cutoff |
| 2000 g | 2.00 kg | 4 lb 7 oz | Low birth weight |
| 2500 g | 2.50 kg | 5 lb 8 oz | Term low-normal |
| 3000 g | 3.00 kg | 6 lb 10 oz | Common term weight |
| 3500 g | 3.50 kg | 7 lb 11 oz | Common term weight |
| 4000 g | 4.00 kg | 8 lb 13 oz | Macrosomia threshold |
| 4500 g | 4.50 kg | 9 lb 15 oz | Large newborn |
🗃10th, 50th, and 90th Percentile Weights by Week and Sex
| Weeks | Boys 10th | Boys 50th | Boys 90th | Girls 10th | Girls 50th | Girls 90th |
|---|---|---|---|---|---|---|
| 24 | 533 g | 660 g | 787 g | 509 g | 630 g | 751 g |
| 26 | 733 g | 900 g | 1067 g | 700 g | 860 g | 1020 g |
| 28 | 943 g | 1150 g | 1355 g | 902 g | 1100 g | 1297 g |
| 30 | 1214 g | 1470 g | 1723 g | 1157 g | 1400 g | 1641 g |
| 32 | 1522 g | 1830 g | 2133 g | 1456 g | 1750 g | 2039 g |
| 34 | 1886 g | 2250 g | 2608 g | 1803 g | 2150 g | 2492 g |
| 36 | 2280 g | 2700 g | 3111 g | 2178 g | 2580 g | 2972 g |
| 38 | 2700 g | 3180 g | 3646 g | 2589 g | 3050 g | 3497 g |
| 40 | 3035 g | 3570 g | 4089 g | 2916 g | 3430 g | 3929 g |
| 42 | 3199 g | 3780 g | 4344 g | 3081 g | 3640 g | 4183 g |
⚙Formula Breakdown
💡Reading the Result Well
But it’s a coordinate; not a verdict. It’s true that two and a half kilograms look tiny compared with an average baby born at forty weeks, but big compared with one delivered at thirty-five. You can’t interpret that raw number until you understand how it compares to thousands of other babies of same sex and gestation. And then, once you’ve got that comparison, you turn it into a percentile.
You know: Where does my baby sit in that distribution? This is the step that transforms a simple mass into something meaningful. The calculator on this page do the math for you, but knowing what it all means requires more than just knowing the number. The health picture is not one size fits all (as in one target weight), but rather a spectrum. A growth percentile is just that: A ranking compared to other kids on a spectrum.
How Baby Weight Percentiles Work
For example, if you have a fiftieth percentile newborn, half will weigh more then her and half less. That’s called the median. The catch? The median shift every single week of pregnancy. The median changes by the minute during pregnancy. By the week. A tiny-looking full-term newborn could be a nice strong baby two weeks prior. In utero, babies grows fast.
It all comes down to context. How does it handle those curves? By using the LMS method. That’s short for Lambda, Median, and Sigma. Does it sound like Greek mythology? It’s really just a nifty statistical shortcut. There is tables of these three values available by weeks of gestation and sex. They paint a complete picture of distribution of weights in the population.
The median value represent the middle. The skew factor adjust for asymmetry (weight distributions aren’t exactly symmetrical). And the coefficient of variation define how spread out things are. With those three numbers, the calculator can produces whatever percentile is desired without having to have a giant lookup table containing all potential weights. It is elegant because simple data captures complicated biology.
It takes the data you entered, your baby’s sex, gestational age, and his/her weight (in either pounds/ounces or grams). It then translates it all into grams and calculate a z-score for you. This score show how many standard deviations your baby’s weight is from middle (median) weight range. Zero is always the fiftieth percentile. Numbers above zero are larger weights. Numbers below zero are smaller weights.
Then it uses this z-score and fits it to normal distribution, or standard normal curve, to give you the corresponding percentile. Why does that matter? Because that’s usually what doctors has been trained to consider: percentiles, not some more abstract statistical deviation. Here’s how they break down: Appropriate for gestational age means a baby is between tenth and ninetieth percentiles. A baby below the tenth percentile is small for gestational age. Above the ninetieth percentile is large for gestational age.
Here are a few quick notes. Those numbers aren’t diagnoses; they’re screens. If a baby is in the eighth percentile, say, that doesn’t mean anything’s wrong if her development has been consistent. And a baby who comes in at the ninety-fifth percentile may simply have tall parents. These names signal closer monitoring, especially when it comes to trouble with feeding or blood sugar levels, but they don’t spell out what will happen next.
Your guess as to when you are dating also matters a lot. Because in late pregnancy, the median weight change rapidly, a week’s change makes a huge difference in percentile. First trimester ultrasound data is usually the most accurate. Enter those into the tool if available.
• Boys weigh more than girls throughout all stages of pregnancy. This explains why the tool include that question, because not accounting for it blurs the image and makes normal variation appear abnormal.
In the end, a birth weight percentile is an in-the-moment snapshot, taking a baby’s growth relative to a population as a reference. From the third to the ninety-seventh percentile, there are healthy babies all along the curve. The real issue is how their weight fits with their length and head size, and whether or not they’re trending up or down. And, truth be told, a number doesn’t necessarly tell the full story.
The best thing you can do is bring the number to your care team, who will use the wider clinical picture; which no calculator could of ever capture, to inform the discussion. The number on the scale is only the beginning of that conversation.