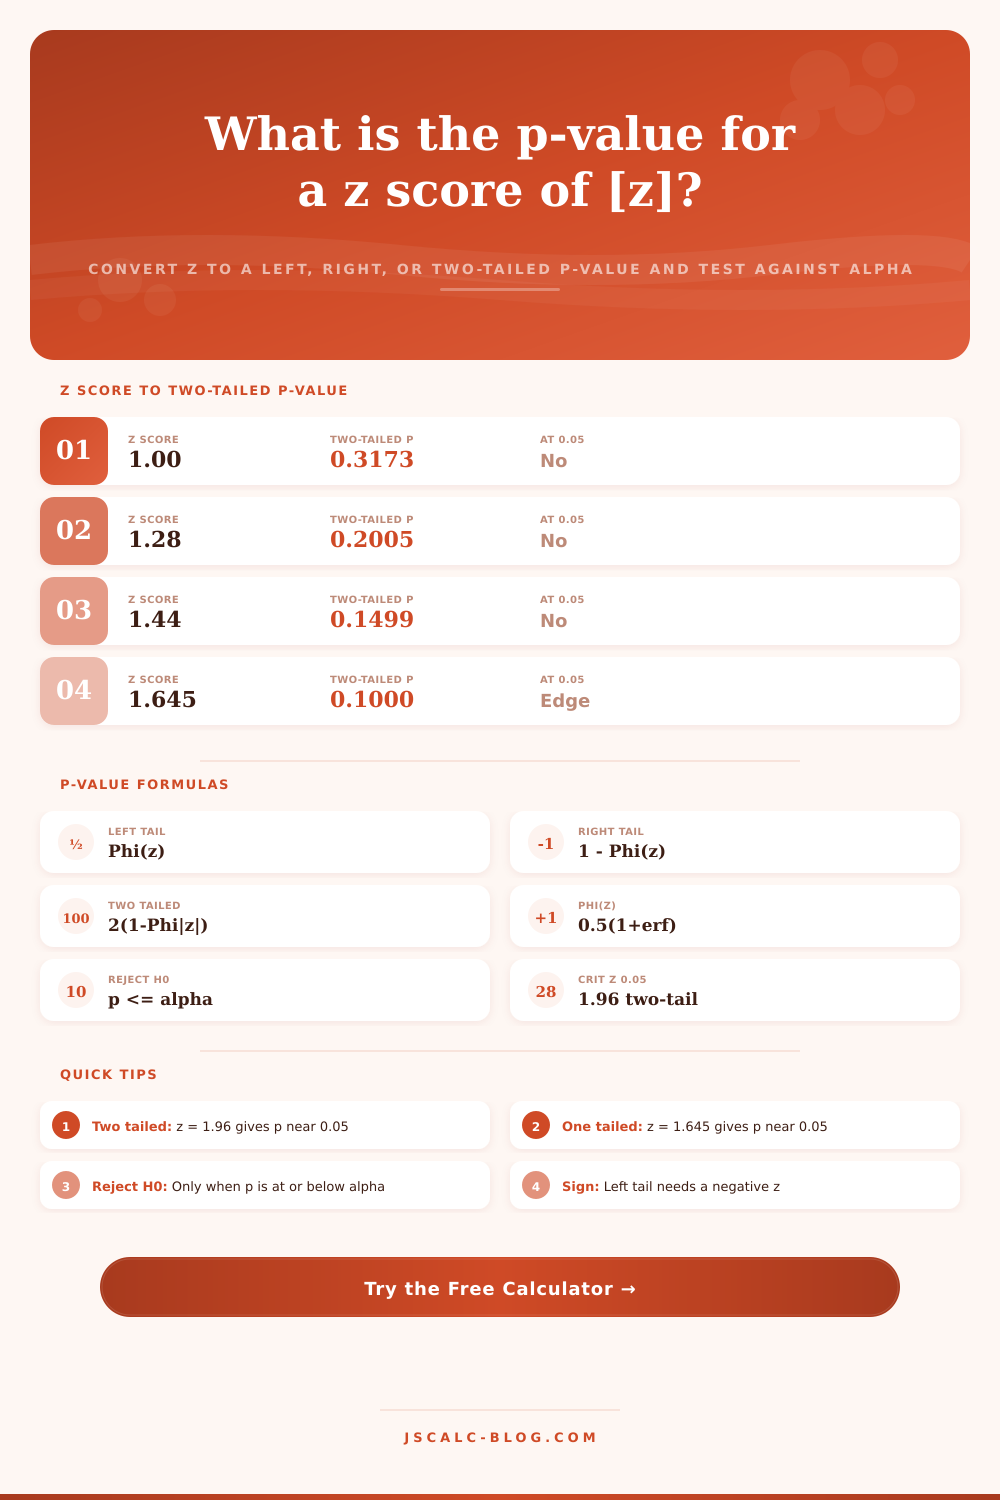
P-Value Calculator From a Z Score
Turn a z-score into a p-value for a left-tailed, right-tailed, or two-tailed hypothesis test. The tool uses an accurate normal CDF, compares the p-value against your significance level alpha, reports the cumulative probability Phi(z), and shows the critical z you would need to reject the null hypothesis.
🎯Real Z Score Presets
📝Test Inputs
Your standardized test statistic. Negative values sit in the left tail.
Two-tailed doubles the smaller tail area for a not-equal alternative.
The threshold you reject the null hypothesis at when p is at or below it.
Enter any value between 0.0001 and 0.5, for example 0.025.
Controls rounding on the p-value and probability cards.
Cosmetic label used in the interpretation sentence only.
🔢Formula Snapshot
📋Common Z to Two-Tailed P-Value
| Z Score | Two-Tailed P | One-Tailed P | Confidence |
|---|---|---|---|
| 1.000 | 0.3173 | 0.1587 | 68.3% |
| 1.282 | 0.2005 | 0.1003 | 80.0% |
| 1.440 | 0.1499 | 0.0749 | 85.0% |
| 1.645 | 0.1000 | 0.0500 | 90.0% |
| 1.960 | 0.0500 | 0.0250 | 95.0% |
| 2.000 | 0.0455 | 0.0228 | 95.4% |
| 2.326 | 0.0200 | 0.0100 | 98.0% |
| 2.576 | 0.0100 | 0.0050 | 99.0% |
| 3.000 | 0.0027 | 0.0013 | 99.7% |
| 3.291 | 0.0010 | 0.0005 | 99.9% |
📏Critical Z by Alpha and Tail
| Alpha | Left-Tailed | Right-Tailed | Two-Tailed |
|---|---|---|---|
| 0.10 | -1.282 | +1.282 | ±1.645 |
| 0.05 | -1.645 | +1.645 | ±1.960 |
| 0.025 | -1.960 | +1.960 | ±2.241 |
| 0.01 | -2.326 | +2.326 | ±2.576 |
| 0.005 | -2.576 | +2.576 | ±2.807 |
| 0.001 | -3.090 | +3.090 | ±3.291 |
🔍Interpreting a P-Value Range
| P-Value Range | Evidence vs H0 | At Alpha 0.05 | Plain Reading |
|---|---|---|---|
| p > 0.10 | Weak | Fail to reject | Consistent with chance |
| 0.05 to 0.10 | Marginal | Fail to reject | Suggestive only |
| 0.01 to 0.05 | Moderate | Reject | Statistically significant |
| 0.001 to 0.01 | Strong | Reject | Highly significant |
| p < 0.001 | Very strong | Reject | Extremely significant |
| p = alpha | Boundary | Reject (edge) | Exactly on the line |
📈What a Z Score Means
| Z Score | Position | Percentile | Interpretation |
|---|---|---|---|
| 0.00 | At the mean | 50.0% | Perfectly typical |
| +1.00 | 1 SD above | 84.1% | Somewhat high |
| -1.00 | 1 SD below | 15.9% | Somewhat low |
| +1.96 | Near 2 SD up | 97.5% | Unusually high |
| -1.96 | Near 2 SD down | 2.5% | Unusually low |
| +3.00 | 3 SD above | 99.9% | Extremely rare |
🗃Z Score to P-Value Comparison Grid
| Z Score | Left P = Phi(z) | Right P = 1-Phi(z) | Two-Tailed P | Significant at 0.05 | Interpretation |
|---|---|---|---|---|---|
| 0.50 | 0.6915 | 0.3085 | 0.6171 | No | Very weak evidence |
| 1.00 | 0.8413 | 0.1587 | 0.3173 | No | Weak evidence |
| 1.645 | 0.9500 | 0.0500 | 0.1000 | Edge one-tail | One-tailed boundary |
| 1.96 | 0.9750 | 0.0250 | 0.0500 | Yes (boundary) | Two-tailed boundary |
| 2.33 | 0.9901 | 0.0099 | 0.0198 | Yes | Moderate evidence |
| 2.576 | 0.9950 | 0.0050 | 0.0100 | Yes | Strong evidence |
| 3.00 | 0.9987 | 0.0013 | 0.0027 | Yes | Very strong evidence |
| -1.96 | 0.0250 | 0.9750 | 0.0500 | Yes (boundary) | Low tail boundary |
⚙Formula Breakdown
💡Hypothesis Testing Tips
Take a number. It is something you got out of a textbook problem or based off of a spreadsheet. Until you turn it into a real risk, it can feel abstract. What the p-value calculator above does for you are make that translation.
It turns a standardized z-score into the probability that serves as the base of almost all hypothesis tests. Enter the stat, choose your alpha level, and then direction of the tail you’re interested in. And voila! Out pops a p-value, which is cumulative probability. This gives you a definitive “yes” or “no” answer regarding whether to reject null hypothesis. It also provides important critical boundary to watch.
How to Use the P-Value Calculator
The basic normal cumulative distribution function are accurate, which means numbers line up with the published tables, no more of those pesky rounding error that always seem to crop up when looking things up manualy.
Distance isn’t everything. That’s what the z-score tells you: How far away from mean are you, and by how many standard deviation? To get the other piece, you have to convert that into a p-value… Which is chance of seeing such an extreme result if the null hypothesis were true. Phi(z) is area beneath the curve up to that point; it’s the step from one to the other.
Why does a z-score of 1.96 correspond to a p-value of 0.05 (the most-quoted threshold in statistics) when using a two-tailed test? Because Phi(1.96) = 0.975. The tool doesn’t store an endless table in its computer memory, either; instead, it computes Phi(z) instently with the error function. It relies on a solid approximation that introduces no meaningful error compared to ones published in literature. These errors compound toward the tails, where your choices will matter most. It does all the hard math of polynomials and exponentials for you so you can interpret rather than derives.
What does this mean? The answer depends on which tail you use. If you’re doing a left-tailed test (e.g., asking whether a number is substantially lower then expected), you’re looking at how much area lies to the left of z. If you’re doing a right-tailed test (e.g., checking whether something is substantially higher than expected), you’re examining how much area lie to the right. But if you’re conducting a two-tailed test (i.e., seeing if there’s any difference at all, in either direction)…you double the smaller end of the tail. Which is why, for instance, z = 1.96 corresponds to a p-value of 0.05 when we do a two-tailed test, but only about 0.025 when we do a one-tailed one.
Pick your tail beforehand; otherwise, you might be raising your false positive rate just to pursue significance. All of this results in four cards that presents a full picture. There’s the headline number (the p-value), the one we all look at and compare to our alpha. Then there are two more card: one with the raw left-tail area (Phi(z)). Handy if you want to double-check your own math. And another card that just says it outright: do you reject the null? Or not, based off the significance level you’ve set. Finally, there’s critical z card with actual boundary value.
It presents a step-by-step explanation of what went where. This lets you see exactly how it came up with that answer and use tool to check your manual calculations.
The other side of that coin is alpha, or the risk you take when you reject your true null hypothesis (a.k.a. False positive). By default it provides classic alphas,.01,.05,.10, along with a custom option if needed. As alpha decreases, you require greater evidence (higher critical z) and has fewer false positives, though also less likelihood of detecting real effects. The table of critical z values across tails and alphas reflect this. Lower alphas move boundaries from 1.645 for alpha 0.10, to 2.326 for alpha 0.05, to 3.291 for alpha 0.001.
If your p-value is at or below alpha, you’ll reject the null… The data are unlikely if there’s truly no effect. If it’s above alpha, you don’t reject. That’s not the same thing as establishing the null is true; it’s just that you didn’t get enough evidence against it. And this distinction is important, since a large p-value might reflect a genuine absence of effect, or merely that your sample size was too small to resolve such an effect.
There are ten presets that load textbook test scenarios on the fly. These include negative z values and left-tail scenario for standard tests. They also include more common boundary values like 1, 2, or 3-sigma. The comparison grid aligns the z score against its corresponding p-value, and displays significance flags while shrinking the probability as the stat increases. The comparison grid lets you see how small changes in your data impact your conclusions without running the full calculation each time.
It’s annoying to hand-read tables: it’s slow, you’ll make mistakes, and even if you don’t, it won’t be clear what happened if there’s a dropped factor of two (e.g., for two-tailed tests). This tool does away with all that by handling the complex arithmetic and providing a complete breakdown of your results: Combine an accurate normal CDF, some good tail logic, and a critical-value lookup. Enter a z value; select an alpha and tail. Read off a reliable p-value, along with a decision you could of stood behind.