Waist to Height Ratio Calculator
Divide your waist by your height in the same units to get one screening number. See the 0.5 boundary, your healthy maximum waist, the boundary waist values, and the Ashwell risk band. Informational only, not medical advice.
🎯Real WHtR Presets
📝Your Measurements
Children use a slightly wider low-end band; the 0.5 upper boundary stays the same.
Measure over bare skin, relaxed, at the end of a normal breath out.
Left box is feet, right box is inches.
Some guidance flags central-fat risk earlier for South and East Asian adults.
🔢Your Boundary Waist Values
These are the waist sizes that would put you exactly on each Ashwell line at your current height.
📊Ashwell WHtR Bands
| Risk Band | WHtR Range | What It Suggests | Typical Message |
|---|---|---|---|
| Slim / take care | Below 0.40 | Low central fat, possibly underweight | Check you are eating enough |
| Healthy | 0.40 to 0.4999 | Waist under half of height | Maintain your habits |
| Increased / consider action | 0.50 to 0.5999 | Central fat rising past the boundary | Consider waist-focused changes |
| High risk / take action | 0.60 and above | Higher central fat load | Take action, seek guidance |
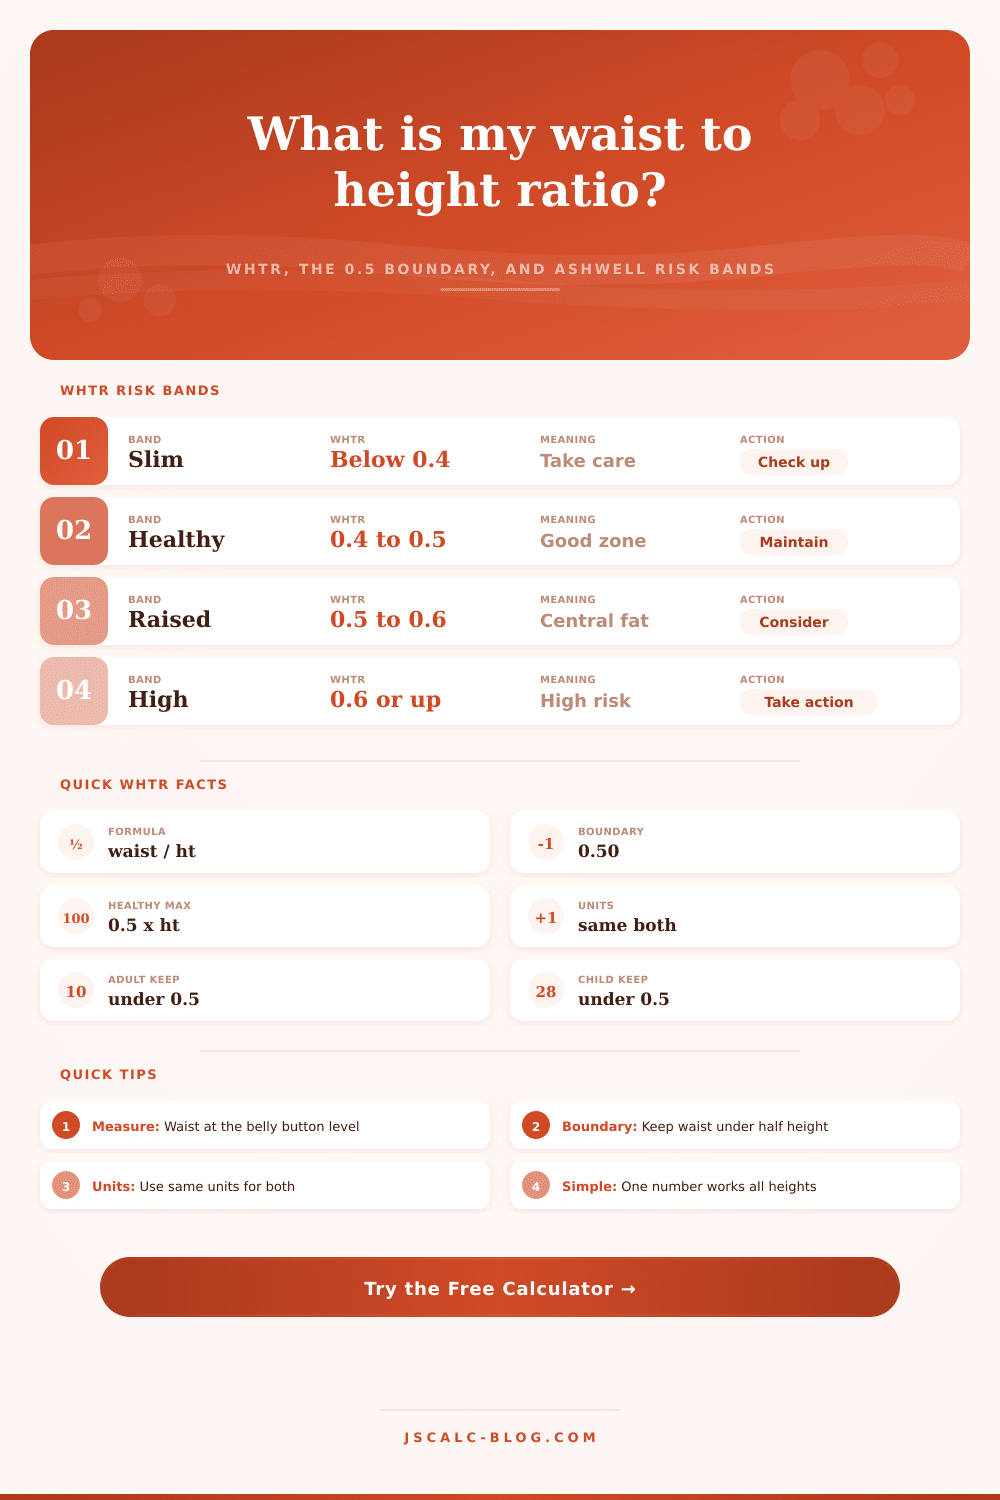
The 0.5 upper boundary is the widely cited rule: keep your waist to less than half your height.
🧒Adult vs Child Boundary Reference
| Group | Keep Below | Low-End Flag | Notes |
|---|---|---|---|
| Adults, general | 0.50 | Below 0.40 | Single boundary works across most heights |
| Adults, South/East Asian | 0.50 (act near 0.48) | Below 0.40 | Central-fat risk can appear a little earlier |
| Children and teens 6 to 17 | 0.50 | Below 0.42 | Same upper line; lower band a touch wider |
| Older adults | 0.50 to 0.55 discussed | Below 0.40 | Some studies allow a slightly higher ceiling |
Boundaries here are screening references, not diagnostic thresholds.
📐Healthy Waist Target By Height
| Height | Healthy Max (0.50) | Lower Guide (0.40) | High-Risk Line (0.60) |
|---|---|---|---|
| Calculate to see the target table in your chosen units. | |||
Keeping your waist at or below the 0.50 column keeps your ratio under the boundary.
🗂WHtR vs BMI Comparison
| Feature | WHtR | BMI | Waist Alone | Best Use |
|---|---|---|---|---|
| What it uses | Waist and height | Weight and height | Waist only | WHtR adds height context |
| Central fat signal | Strong | Weak | Moderate | WHtR or waist |
| Works across heights | Yes, one boundary | Yes | No, needs height | WHtR |
| Muscle bias | Low | Can misread muscle | Low | WHtR for athletes |
| Simple boundary | 0.50 for all | Age/sex tables | Sex-specific | WHtR is easiest |
| Kids and teens | 0.50 line usable | Percentile charts | Less common | WHtR is simple |
| Equipment | Tape measure | Scale plus height | Tape measure | WHtR is cheap |
⚙Full Formula Breakdown
📋Worked Example Reference
| Person | Waist | Height | WHtR | Band |
|---|---|---|---|---|
| Lean adult | 30 in | 68 in | 0.44 | Healthy |
| On the line | 35 in | 70 in | 0.50 | Boundary |
| Raised waist | 40 in | 69 in | 0.58 | Increased |
| Metric adult | 80 cm | 175 cm | 0.46 | Healthy |
| High risk | 110 cm | 170 cm | 0.65 | High risk |
| Teen male | 27 in | 63 in | 0.43 | Healthy |
💡Practical WHtR Tips
If you’ve ever used a waist tape, it usualy sits in a drawer. You might take it out to see if a pair of pants will fit, or maybe because you think something isn’t quite right with your health. When you step on the scale, you’re really only looking at part of the picture.
For example, a bodybuilder may weigh the same as a sedentary person. However, since muscles is denser than fat, that person have different health risks despite their similar weight. The waist-to-height ratio ignores total mass of the person and simply looks at how much that mass is in the center. Because central fat is metabolically active (subcutaneous fat is not) and also wraps around the body’s organs, this is more than simply an appearance issue or a sizing concern for clothing. It’s a clear indicator of what is going on inside.
Why Waist-to-Height Ratio Is Important
Why? Because it’s simple math. Divide your waist size (in centimeters) by your height (in centimeters). That’s all there is to it. For example: if your waist measures 80cm and your height is 160cm, then you would divide 80/160. Enter your data into the calculator here, and it will do the work for you.
But what does that number mean? What’s the magic line where experts say we get worried about our waist-to-height ratio? 5. That’s right: Your waist should be no more than half as large as your overall height. And this cutoff holds true for nearly every human being of any height. Whether you’re five-feet-tall or six-feet-six-inches, the goal is still the same proportion of midsection fat.
This ratio is so strong because it is universal. Other ratios, such as those used on BMI tables, vary depending off factors like gender and age. The only place most folks mess up is measurement. It’s important to take a measuring tape (a flexible one) and wrap it around your waist, right at your belly button or just above your hip bones. It depends on the protocol you use.
Don’t pout your tummy out or suck it in. It’ll give you an inaccurate number. So breathe out normally and have it sit snugly on your body but never dig into your skin. Why this whole relaxed thing matters: It makes a huge difference to how tight your measurement is! The tool adjusts based on what point along the waist you’re measuring so you choose which works best for you.
And 0.5 stays constant throughout development. That’s why this particular number is significant: multiple decades worth of research points to visceral fat as releasing free fatty acids and inflammatory markers straight into the liver via the portal vein. Before you have any other symptom, this flood of metabolic noise will disrupt how well the liver handles cholesterol and insulins. You should of known that weight loss isn’t just about numbers.
The Ashwell chart I mention in the results above divides these risks into bands, not just one pass/fail grade. Being under 0.4 might indicate you are lean but could also suggest you are underweight depending on your overall context. Landing between 0.4 and 0.5 is generally considered the healthy zone where your risk of metabolic complications remains low. The 0.5 to 0.6 range means you’re amassing central fat faster then normal, which is why you’ll want to pay attention to your activity and diet. Above 0.6 indicates high risk where medical guidance becomes advisable.
Ethnicity plays a part here as well. There’s some evidence that people of South and East Asian descent are more prone to storing visceral fat even when they have lower body weights. Your biology matters. And that’s why there’s a checkbox on the calculator to indicate this. You don’t get stigmatized; you just get flagged to start at a lower threshold if that applies to you. You might aim for something like 0.48 instead of going all the way up to 0.5. The tool takes that into account with its messages to keep things personal, not one-size-fits-all.
Weight loss isn’t about battling gravity, it’s about managing geometry. Your body doesn’t need to lose any weight from your legs or arms if they’re in good shape, you shrink your waistline by changing what you eat and how strong your abs are. You can improve your insulin sensitivity by walking every day (insulin pulls glucose from your blood stream so you don’t store it around your middle). Building muscle mass through strength training also raises your metabolism even when you aren’t working out. Both of these things compound over time to lower that ratio without extreme restriction.
But that’s what makes this metric so beautiful: it’s simple. There’s no guessing with this metric. There’s nothing complicated about getting started. You do not need a special scan or a complicated chart. Take a measurement. Divide. Compare. If your waist is less than half your height, you’re probably in good shape internally. The problem here is that people believe it has to be perfect, when all it needs to be is proportional.