PSA Velocity Calculator
Track how fast prostate-specific antigen is rising. Enter two or three PSA readings in ng/mL with the months from the first test to get PSA velocity in ng/mL per year, PSA doubling time in months, total percent change, and an educational risk category based on the Carter and Oesterling thresholds.
🎯Real Case Presets
📝PSA Readings and Timing
Three readings over 18+ months are most reliable.
Arithmetic averages each interval slope; first-to-last uses only the endpoints.
The earliest baseline result, taken as time zero.
The middle result when using three readings.
Elapsed months since reading 1, not a calendar date.
The most recent result, the last point in the trend.
Total elapsed months from reading 1 to reading 3.
Used for the age-specific upper-normal PSA context card.
🔢Formula Snapshot
📊PSA Velocity Risk Thresholds
| Velocity (ng/mL/yr) | Baseline PSA | Meaning | Typical Action |
|---|---|---|---|
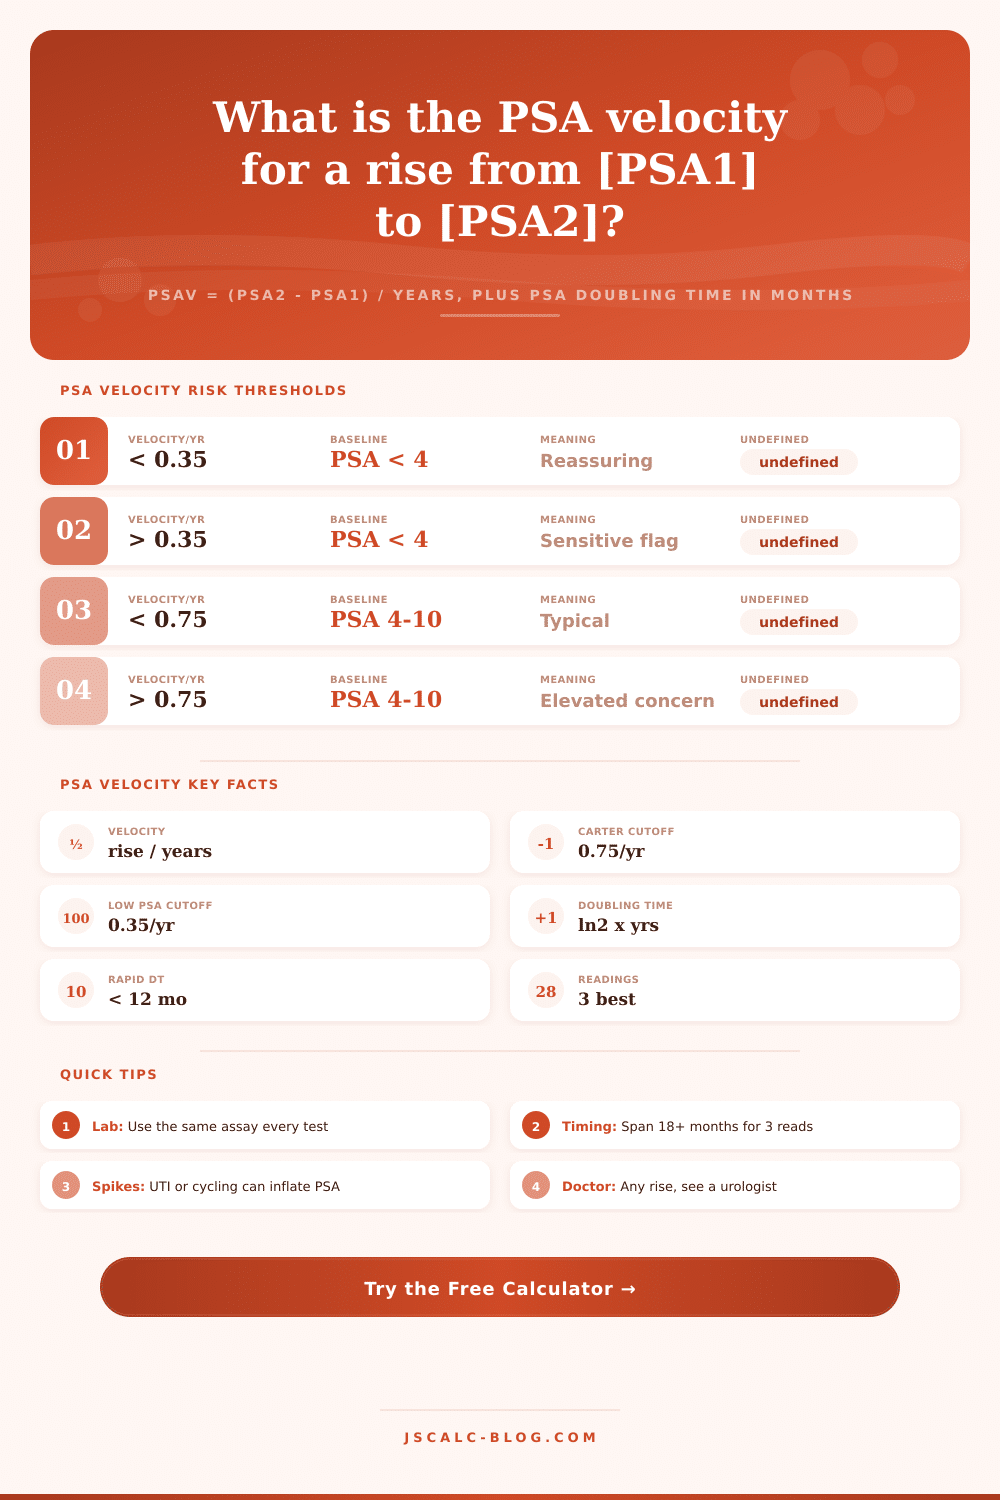
| Below 0.35 | Under 4 | Reassuring, slow trend | Routine interval testing |
| Above 0.35 | Under 4 | Sensitive early flag | Repeat and confirm trend |
| Below 0.75 | 4 to 10 | Within typical range | Continue monitoring |
| Above 0.75 | 4 to 10 | Elevated concern (Carter) | Discuss with urologist |
| Above 2.0 | Any level | Linked to aggressive disease | Prompt specialist review |
| Around 0.0 | Any level | Flat, no meaningful rise | Reassurance, keep watching |
📅Age-Specific Upper-Normal PSA (Oesterling)
| Age Range | Upper Normal (ng/mL) | Interpretation | Note |
|---|---|---|---|
| 40 to 49 | 2.5 | Lower baseline expected | Small gland, younger men |
| 50 to 59 | 3.5 | Mild age-related rise | Common screening decade |
| 60 to 69 | 4.5 | Gradual normal increase | Gland enlarges with age |
| 70 to 79 | 6.5 | Highest normal ceiling | Benign growth is typical |
⌛PSA Doubling Time Interpretation
| Doubling Time | Pace | General Meaning | Context |
|---|---|---|---|
| Over 36 months | Slow / indolent | Low kinetic concern | Often active surveillance |
| 12 to 36 months | Intermediate | Warrants closer follow-up | Trend matters more here |
| Under 12 months | Rapid | Higher kinetic concern | Specialist input advised |
| Under 3 months | Very rapid | Aggressive kinetics | Urgent evaluation likely |
| Not rising | N/A | PSA flat or falling | Doubling time undefined |
🗃Worked PSA Velocity Comparison Grid
| PSA 1 | PSA 2 | Months | Velocity/yr | Doubling (mo) | Category |
|---|---|---|---|---|---|
| 1.0 | 1.2 | 24 | 0.10 | 92.4 | Low |
| 2.0 | 2.4 | 12 | 0.40 | 45.6 | Monitor |
| 3.0 | 3.9 | 12 | 0.90 | 31.7 | Elevated |
| 2.5 | 2.5 | 18 | 0.00 | N/A | Low |
| 4.0 | 6.5 | 12 | 2.50 | 17.1 | Elevated |
| 1.5 | 1.9 | 15 | 0.32 | 44.1 | Monitor |
| 5.0 | 7.0 | 10 | 2.40 | 20.6 | Elevated |
| 3.2 | 4.6 | 9 | 1.87 | 17.2 | Elevated |
| 0.8 | 0.9 | 24 | 0.05 | 141.2 | Low |
| 6.0 | 9.0 | 6 | 6.00 | 10.3 | Elevated |
⚙Formula Breakdown
💡PSA Velocity Reliability and Safety
The PSA Velocity Calculator converts a sequence of prostate-specific antigen blood tests into a clear picture of the rate at which that number changes over time. While a PSA value itself give you a sense of your current state, knowing the rate of change over time (the trend) can be even more significant, as it indicates whether your PSA is rising rapidy from one year to the next. Built to accept two or three PSA readings (in units of ng/mL), and the number of months from the first test, this tool outputs an educational risk category, total percent change, the PSA doubling time in months, and the PSA velocity in units of ng/mL per year. It is meant to help you talk with a clinician and learn about trends, not for diagnose yourself.
PSA velocity (aka PSAV) is the rate of increase in PSA in nanograms per milliliter per year. Velocity doesn’t ask if any one reading is too much. It asks: How fast it is rising? If your PSA rises from 1.2 to 2.1 ng/mL in two years, you’re on a slower path then someone who went from 1.2 to 4.0 in six months. At some moment, both might be within a lab’s reference range, yet one is going up faster. This is what Dr. H. Ballentine Carter and his team helped make PSA velocity popular. The rate of change provide another piece of data not captured by just a single number. The PSA velocity calculator makes that rate clear to view, making the trend obvious.
What PSA Velocity Tells You
Two point is easiest: PSAV = (PSA2, PSA1) / (years). Years are simply months/12. So if your PSA climbs 0.4 ng/mL in an entire year’s time, that’s a velocity of 0.40 ng/mL/yr. Classic Carter favors averaging the rates from each interval with three readings; he wants to smooth out the bouncing around seen with single blood draw. Add the first and last rates to the second-to-last rate, then divide that total by two to get PSAV. That is some complicated math! You get to pick which simple formula to use, such as a first-to-last slope or an arithmetic average across all points. That way we can see whether it shifts results much, and which one are preferred.
A related question is answered by doubling time: How long in months would it take for PSA to double at this rate? I used the classic logarithmic formula (natural log of 2 times the elapsed months minus the natural log of initial PSA minus final PSA). If PSA isn’t rising (or even falling), then doubling time doesn’t apply, so the calculator will say “not applicable” or “not rising.” That’s important because we don’t want a spurious number to show up.
Total percent change is just that… The simple comparison of start and end PSA values. To calculate it, take the change (final, initial), divide it by the starting value, and multiply by 100. This shows you whether PSA has gone up or down overall. Four cards provide all of the calculations. The percent change card presents the net change from initial to final reading. The PSA velocity card displays the velocity in ng/mL/year along with corresponding cutpoint. The doubling time card provides the number of months required for a doubling and describes the speed as rapid, intermediate, slow, or very slow. Finally, the risk category card combines it all, putting it into Low, Monitor, or Elevated Risk according to age context and velocity thresholds. A detailed breakdown panel follows. It shows all the readings, total range they cover, and the age-normal ceiling. With this you can follow every step of the number crunching.
It’s based on familiar prostate benchmarks. Carter defines the classic “elevated concern” cut-off for a rising PSA velocity as greater than 0.75 ng/mL per year for a baseline PSA between 4 and 10 ng/mL. Because you need to be concerned about a rise sooner when your baseline PSA is low, he has a more sensitive cut-off: 0.35 ng/mL per year for a baseline below 4. A velocity above 2.0 ng/mL per year in the year before diagnosis has been associated with more aggressive disease, which is why it’s flagged prominently here.
To add another complication to the analysis, consider doubling time. Slow disease lasts more than 36 months, while intermediate lasts 12 to 36 months. Rapid would be < 12 months, and very rapid would be < 3 months. Because of the natural tendency of PSA to increase with age (as the prostate gets bigger), the calculator also includes the upper-normals for each age range taken from research of Joseph Oesterling and his colleagues. They’re generally quoted as being 2.5 ng/mL at age forty; 3.5 at fifty; 4.5 at sixty; and 6.5 at seventy. The calculator will indicate whether a person’s most recent result falls inside or outside the presumed ceiling for their decade when you enter their age. That provides some perspective into why an identical numerical PSA result might mean something different to you than it does to your best friend.
For instance, there are ten presets to help you try out various scenarios that behave realistically. Borderline 0.75/yr is exactly on the traditional cut-off line. Slow Rise Normal is a comforting but gradual incline. Rapid Rise higher than 2 and Doubling lower than 12 months indicate worrisome patterns. Stable Flat PSA indicates a number that never changes, which means there is no doubling to track. There are also others, like High Baseline in the fifties, Age 70 Range, Two Readings Only, Post-Treatment Watch, and Active Surveillance, which reflect typical monitoring circumstances. They all populate the readings, months, and age simultaneously, allowing you to immediately view a full scenario.
If there are multiple values (at least three) within a time frame of 18+ months, each measured in the same assay and lab, then that velocity is most reliable. Consistency counts because small variations due to method and the usual ups-and-downs of biology can skew a brief trend. And keep in mind: even one high PSA value may simply reflect an infection in the prostate (prostatitis), a urinary tract infection, recent ejaculation, or even a strenuous bicycle ride. None of those reasons implies cancer.
That is why this tool is for educational use only. It isn’t a diagnostic tool at all. If your PSA rises, if you have what you consider a worrisome reading, or if your velocity is outside the ranges depicted here, talk to a qualified urologist who will order appropriate follow-up. The calculator is intended as a way to get smarter about your results (including how to ask better questions), but not for draw conclusions yourself.