Prostate Cancer Probability Calculator
Estimate the probability of finding prostate cancer, and separately high-grade (Gleason 7 or higher) cancer, on a prostate biopsy. This educational tool combines age, serum PSA, digital rectal exam, family history, prior biopsy, and race into a PCPT/PBCG-style logistic risk model.
🎯Real Patient-Style Presets
📝Patient Inputs
Patient age in years, typically 40 to 90.
Total prostate-specific antigen from a blood test.
An abnormal DRE raises the estimated risk.
First-degree relatives shift risk upward.
A previous negative biopsy lowers the odds.
Ancestry adjusts baseline population risk.
Adds an extra high-grade risk adjustment.
Used only to report PSA density (PSA / volume).
🔢Logistic Model Snapshot
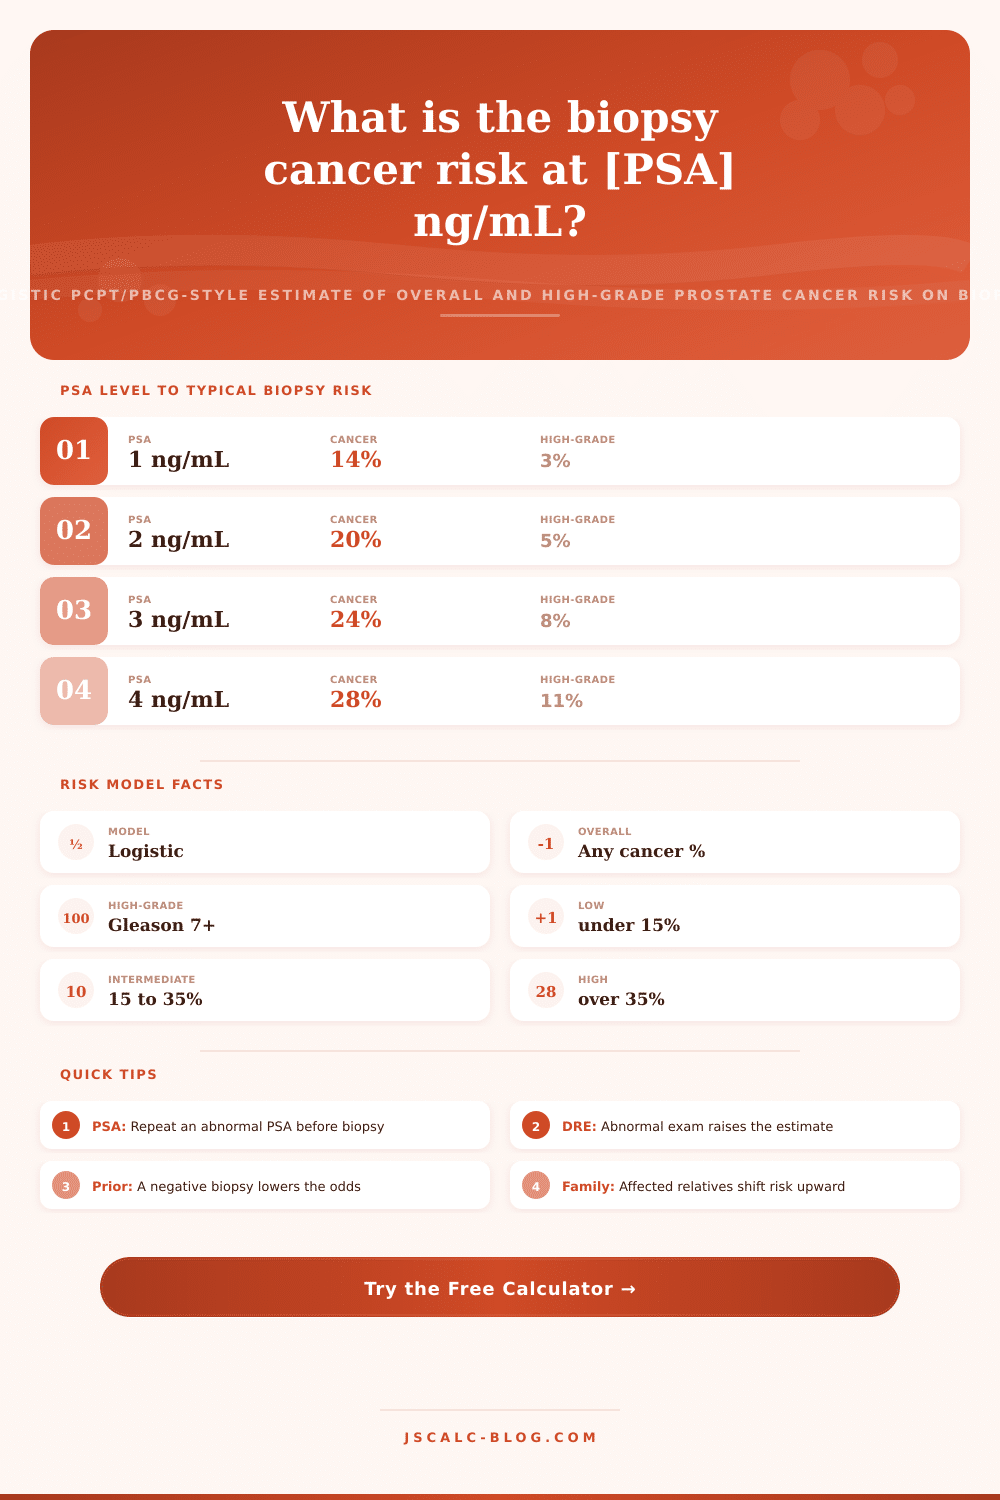
📋PSA Range and Typical Biopsy Risk
| Serum PSA | Interpretation | Typical Cancer Risk | High-Grade Share |
|---|---|---|---|
| 0 to 1 ng/mL | Very low | About 10 to 14% | Low |
| 1 to 2.5 ng/mL | Low | About 15 to 22% | Low |
| 2.5 to 4 ng/mL | Borderline | About 22 to 28% | Low to moderate |
| 4 to 10 ng/mL | Gray zone | About 28 to 43% | Moderate |
| 10 to 20 ng/mL | Elevated | About 43 to 57% | High |
| Above 20 ng/mL | Markedly high | About 57 to 70%+ | Very high |
📊Age-Specific PSA Reference Ranges
| Age Band | Upper Normal PSA | Median PSA | Note |
|---|---|---|---|
| 40 to 49 | 2.5 ng/mL | 0.7 ng/mL | Baseline reference |
| 50 to 59 | 3.5 ng/mL | 0.9 ng/mL | Screening often starts |
| 60 to 69 | 4.5 ng/mL | 1.3 ng/mL | Gland enlarges with age |
| 70 to 79 | 6.5 ng/mL | 1.7 ng/mL | Higher normal ceiling |
| Black men, all ages | Lower thresholds | Varies | Consider earlier workup |
🧬Gleason Grade Groups
| Grade Group | Gleason Score | Grade | General Outlook |
|---|---|---|---|
| Group 1 | 3 + 3 = 6 | Low grade | Often active surveillance |
| Group 2 | 3 + 4 = 7 | Favorable intermediate | Treatment often discussed |
| Group 3 | 4 + 3 = 7 | Unfavorable intermediate | More aggressive biology |
| Group 4 | 8 | High grade | Treatment usually advised |
| Group 5 | 9 to 10 | Very high grade | Highest recurrence risk |
📏Risk Category Thresholds
| Category | Overall Risk Band | Typical Reading | Common Next Step |
|---|---|---|---|
| Low | Under 15% | Reassuring | Monitor PSA and DRE |
| Intermediate | 15% to 35% | Uncertain | Consider MRI or biomarkers |
| High | Over 35% | Concerning | Discuss biopsy with urologist |
| High-grade flag | Gleason 7+ over 10% | Elevated aggressive risk | Prompt specialist review |
🗃PSA Level Risk Comparison Grid
| Serum PSA | Est. Cancer Risk | High-Grade Risk | Category | Recommended Action | Notes |
|---|---|---|---|---|---|
| 1 ng/mL | About 14% | About 3% | Low | Routine monitoring | Reassuring at any age |
| 2.5 ng/mL | About 22% | About 6% | Intermediate | Repeat and track trend | Watch PSA velocity |
| 4 ng/mL | About 28% | About 11% | Intermediate | Consider MRI | Classic gray-zone value |
| 6 ng/mL | About 34% | About 16% | Intermediate | MRI or biomarker test | Above age-adjusted normal |
| 10 ng/mL | About 43% | About 24% | High | Urology referral | Biopsy commonly offered |
| 15 ng/mL | About 51% | About 32% | High | Biopsy discussion | Staging imaging likely |
| 20 ng/mL | About 57% | About 39% | High | Prompt specialist care | High aggressive risk |
| 30 ng/mL | About 65% | About 49% | High | Urgent evaluation | Rule out spread |
⚙How the Logistic Score Works
💡Practical Guidance
Your urologist sends you home with a piece of paper: a lab slip. On it is single number. That’s your prostate specific antigen (PSA) score. It’s presented as a judgment (a final word). But in truth, it’s the first part of a longer exchange.
Because men hears “normal” or “up,” they think, “healthy” or “sick.” They freeze. There are many factors beyond that single number that define your risk: your age; results of physical exam; your family history; even your heritage. When you grasp those layers, a vague fear become a series of understandable facts.
More Than Just One Number
And then there’s the math part. Enter in your information and the calculator do it all for you (above). You don’t have to guess at the conversions and coefficients. Using a logistic model, it combine your inputs into two different sets of probabilities. The first shows how likely you are to have any cancer on a biopsy. The second calculate your chance of having high grade disease (Gleason 7 or greater). This is important because lower-grade tumors can often be monitored instead of aggressively treated.
If you know where you fall in this range, you’ll better know if it’s time to get an invasive test done, or wait until things become clearer.
And then there’s the silent force: age. Even if you’re not carrying cancer, your prostate simply gets bigger as you get older. That means your PSA will gradually increase with time. What appears like a scary result for a man of 50 could actualy fall well within his normal range as a 75 year old. To take that into consideration, the tool include age (alongside your actual lab results) to weigh the significance of your readings.
And finally there’s the digital rectal exam. While it may sound outdated to some, any new-found hardness or lump during a DRE provides substantial weight on the risk assessment. Otherwise borderline cases can find themselves bumped up to high-risk status based off an abnormal exam, which would trigger an earlier biopsy or other imaging.
The family history alters the baseline, as well. If you have a first-degree relative (father, brother) who’s been diagnosed. Particularly if he was young… Then your personal risk curve begin above average. Share that context with your provider. A previous negative biopsy works the opposite way. Because one clean look didn’t turn up anything, it reduces the estimated risk and lowers the probability.
Your race matters, as well. Rates of aggressive disease is higher among African-American men. The model takes account of this fact, adjusting to ensure that the estimate is based on population-level data different than ignoring known disparities.
That’s where the log (i.e., PSA) comes into play. A PSA reading of 23 isn’t that different than 20, but it’s light years from a one or four. You want to capture that initial spike with a log function. You must also avoid letting extreme cases warp everything toward a false sense of certainty. So the calculator caps the output at a range from one to ninety nine percent. Nature doesn’t do absolute, after all.
Don’t schedule a biopsy based off one number that’s up. PSA numbers can go up and down for no reason (recent ejaculation, cycling, infection). Repeat a test to confirm. And if your number falls into the “in-between” category, get an opinion first about doing a biomarker panel or getting an MRI, these are less-invasive tests that will sharpen the image without a needle poke.
Don’t run from the number; don’t run with the number. Understand what it might mean to guide the conversation. Which should of been informed by the likelihood you’ll have it happen.