FERS Retirement Calculator
Estimate your Federal Employees Retirement System pension using the high-3 average salary, years of creditable service, the 1.0% or 1.1% annuity multiplier, unused sick leave credit, early MRA+10 reductions, and survivor benefit elections.
🎯Real FERS Scenarios
📝Retirement Inputs
Average of your 3 highest consecutive years of basic pay.
2,087 hours = 1 year. About 174 hours per month.
Applies only when retirement type is Special Provisions.
🔢Formula Snapshot
📊Years of Service to Pension Percent
| Years | At 1.0% | At 1.1% | On $90k H3 | Monthly 1.0% | Notes |
|---|---|---|---|---|---|
| Enter values above to build the service percentage table. | |||||
🗂FERS Multiplier Reference
| Situation | Age | Service | Multiplier | Example on $90k / 30 yr |
|---|---|---|---|---|
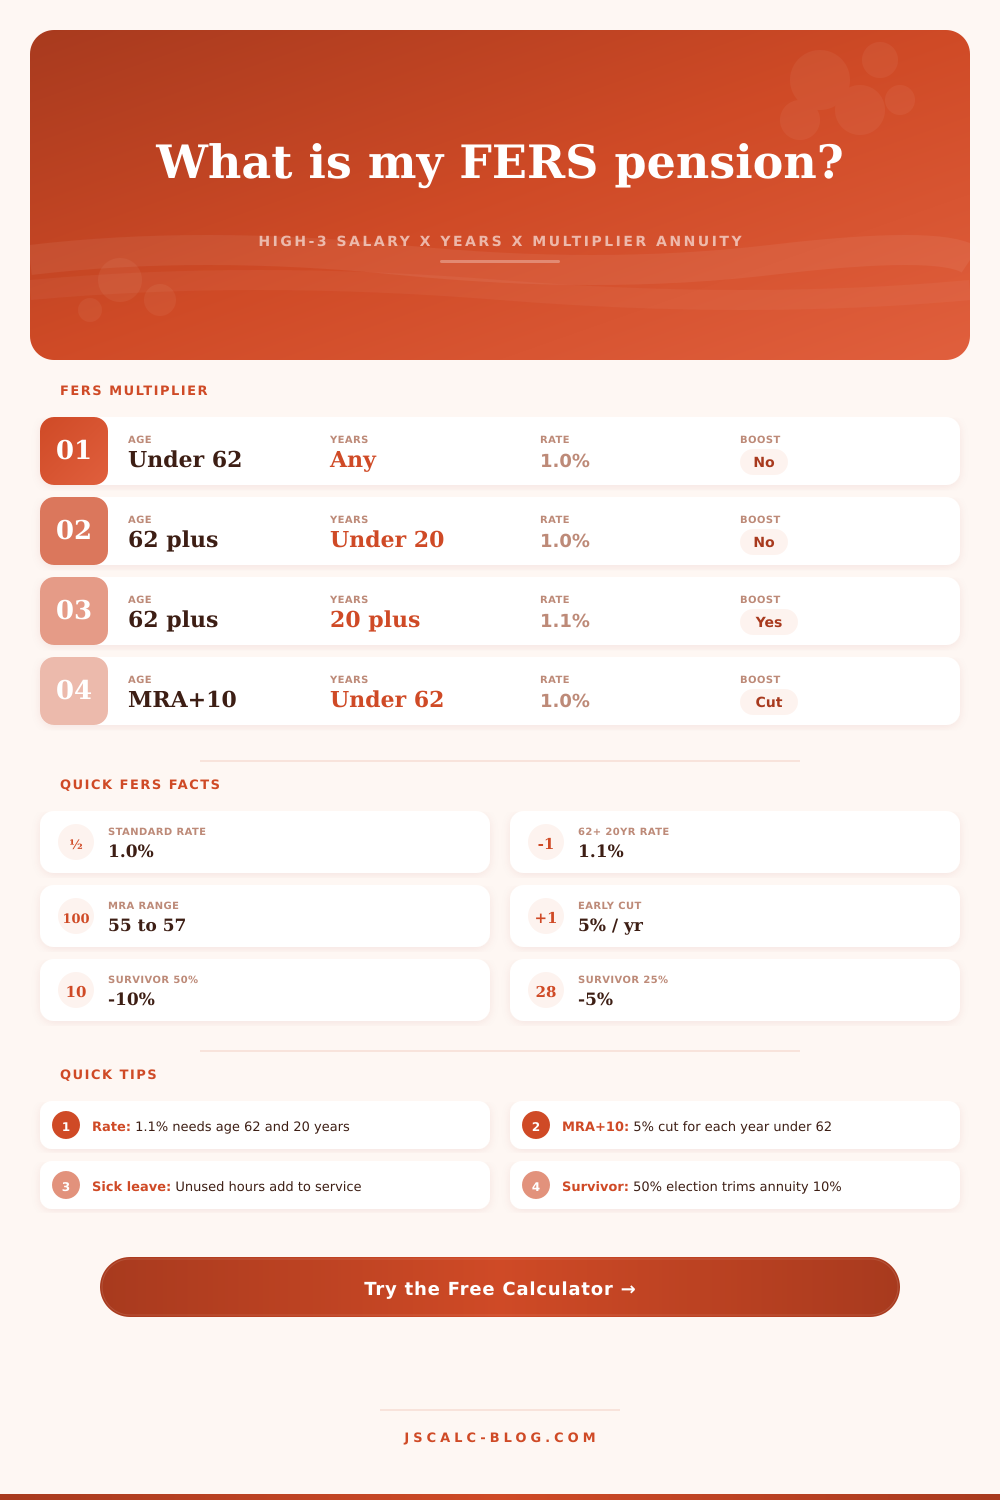
| Standard FERS | Under 62 | Any | 1.0% | $27,000 per year |
| Age 62 without 20 years | 62 or older | Under 20 | 1.0% | $27,000 per year |
| Age 62 with 20 years | 62 or older | 20 or more | 1.1% | $29,700 per year |
| Special provisions base | Any (met) | First 20 yrs | 1.7% | Enhanced early tier |
| Special provisions over 20 | Any (met) | Beyond 20 yrs | 1.0% | Standard on the rest |
📅Minimum Retirement Age by Birth Year
| Birth Year | MRA | Immediate Rule | MRA+10 Option | Notes |
|---|---|---|---|---|
| Before 1948 | 55 | 30 yr at MRA | MRA and 10 yr | Oldest tier |
| 1948 to 1952 | 55 + months | Rises by 2 mo/yr | Reduced if under 62 | Transition band |
| 1953 to 1964 | 56 | 30 yr at MRA | 5% cut per yr under 62 | Common cohort |
| 1965 to 1969 | 56 + months | Rises by 2 mo/yr | Reduced if under 62 | Transition band |
| 1970 and later | 57 | 30 yr at MRA | 5% cut per yr under 62 | Newest tier |
👪Survivor Benefit Reduction Reference
| Election | Annuity Reduction | Survivor Receives | On $27,000 Base | Survivor Gets/Year |
|---|---|---|---|---|
| None | 0% | Nothing | $27,000 to you | $0 |
| 25% (partial) | 5% | 25% of unreduced | $25,650 to you | $6,750 |
| 50% (full) | 10% | 50% of unreduced | $24,300 to you | $13,500 |
⚙Full Formula Breakdown
📋Retirement Type Comparison Grid
| Type | Age Needed | Service Needed | Multiplier | Reduction | Best For |
|---|---|---|---|---|---|
| Immediate (MRA + 30) | MRA (55 to 57) | 30 years | 1.0% | None | Full career at MRA |
| Immediate (60 + 20) | 60 | 20 years | 1.0% | None | Later start, mid service |
| Immediate (62 + 5) | 62 | 5 years | 1.0% or 1.1% | None | Short service, 1.1% at 20 yr |
| MRA+10 early | MRA (55 to 57) | 10 years | 1.0% | 5% per yr under 62 | Leaving before 62 |
| Deferred | 60 or 62 later | 5 or 20 years | 1.0% | None if age met | Separated, claim later |
| Special provisions | 50 or any age | 20 or 25 years | 1.7% then 1.0% | None | LEO, firefighter, ATC |
💡Practical FERS Tips
There are some mysteries regarding federal retirement planning. It is your salary history. You has years of service. How do you take those numbers and translate them into a monthly check? The Federal Employees Retirement System offers a stable system, but without knowing specific rules, you’re likely to be confused by an annuity formula that’s not as clear as you might expect.
Thrift Savings Plan contributions gets most of the attention from most agents. That money compounds over time. But bedrock of your package is the guaranteed pension. Get that base number correct, and you’ll look at financial choices different than during the last decade of your career.
How to Calculate Your Federal Pension
Plug in how many years you have served and your high-3 average salary. Note that this isn’t necessarily your maximum pay during any single year, since it’s the average of your three highest 12-month periods over your career. The calculator then crunches numbers for you. You don’t have to do all the coefficient calculations yourself!
When I show people their high-3 number, they frequently think “Oh, this is my best year.” No: it’s the average of last few years. That means that if you had one great year… Maybe you got promoted temporarily or worked overtime for one year, that doesn’t count as part of your base, unless you keep doing that. If you take a year off and then go back, that one high year won’t inflat your average.
On the other hand, if you work there longer than you otherwise would of, that can realy make a difference, since you’ll be increasing your high-3 by keeping that same high earner going for longer. So you want to know what happens if you leave early on a slightly lower average? Or you stick around for a while longer, extending that high earner period? With this tool, you don’t have to play with a spreadsheet anymore. You can just toggle the variables and instantly see how different amounts of tenure affect the bottom line compared to smaller changes in your paychecks.
The multiplier itself also plays an unexpected role: Not just in whether you’re eligible, but in your age. You might think that such a small fraction would make no noticeable impact, but that additional one-tenth of a percent adds up significantly over 30 years of work life. It adds thousands (or tens of thousands) to your total earnings across your career. You can avoid missing out on this gain simply by waiting an additional couple of years.
A lot of folks take the Minimum Retirement Age and depart, thinking that’s good enough; they never realize they could’ve waited another three or four years, earning that additional bump in return. The table of references on that page makes all this clear, explaining how each year of exceeding the age limit alters the multiplier. If you’re healthy and your family situation permits, then sometimes it’s worthwhile giving up those additional years of salary for that increased rate.
There are hidden taxes on early withdrawals. When you retire early (less than 62), there is a reduction, which acts as a tax on your early withdrawal. For each year before 62, your annuity are reduced by 5%. If you use the MRA+10 provision to retire before 62, your annuity is cut by 5% for every year you are under that age limit. When you choose early retirement, the calculator will calculate this for you automatically and show you how rapidly the percentages add up.
You may think on paper that early retiring for just two years isn’t so bad … until you remember that you’re giving up a lifetime of a larger income stream to pay for two additional years of livig costs. Another wrinkle on this tradeoff is the survivor benefit option. If you elect a 50% survivor benefit, it means that your spouse gets 50% of what you’d earn with no survivor benefit, but that your personal annuity shrink by 10%. This comes down to family choice, but the effect on your finances is instant and permanent.
But there’s one thing we tend to forget when making these calculations: Sick leave! Sick leave is kept in its own HR system and therefore often goes overlooked. But unused sick days adds up as creditable service time. That bank of sick days could easily translate to an additional several months of tenure… Enough to knock off that last percentage point without extending your time on the job by even a single month. It is free tenure. It is waiting. In. The. Vault.
Now comes the tricky part: how do you weigh all of this stuff against your own timeline? You can’t maximize all variables at the same time. If you push hard toward maximizing the.01%, you may end up working longer than you had hoped. Take early retirement, and you’re accepting a lower paycheck. Knowing how much each input weighs will allow you to decide what compromise aligns best with your lifestyle.
The point isn’t simply to get as high a number as possible. It’s to get the right number; one consistent with your post-career lifestyle. That snapshot is the calculator’s job. Your task is to figure out what it says about your everyday spending. If you want all 30 years of MRA, or if you’re planning to jump ship early and accept lower benefits, know precisely what each path will mean in terms of dollars coming into your pocket… So you can plan confidently instead of hoping. That’s when a confusing federal formula becomes a straight-ahead roadmap for the rest of your story.