Unit Economics Calculator
Estimate contribution margin, customer acquisition cost, lifetime value, CAC payback, LTV:CAC ratio, and break-even volume from one clean operating model.
🎯Unit Economics Presets
🧮Business Inputs
The model sets interpretation labels and benchmark hints.
All money fields use the same selected symbol.
Monthly price, order value, retained fee, or gross billings per unit.
COGS, hosting, fulfillment, contractor, or inventory cost tied to one unit.
Applied to revenue before contribution margin is calculated.
Include support labor, refunds allowance, onboarding, or account ops per unit.
For subscriptions use seats or plans; for commerce use monthly orders.
Logo churn per month. Lower churn lengthens expected lifetime.
Use positive expansion, negative contraction, or 0 for no repeat growth.
Used for cohort gross profit and capped lifetime checks.
Marketing, sales, creative, commissions, and tools used to acquire the cohort.
Enter the acquired cohort before activation or quality filtering.
CAC is divided by activated paying customers, not raw leads.
Used to estimate break-even customers and billable units per month.
🔢Current Unit Snapshot
📌Model Benchmarks
📊Preset Scenario Reference
| Scenario | Revenue Unit | Variable Cost | Fee | Units / Customer | Churn | Activation | Use Case |
|---|---|---|---|---|---|---|---|
| SaaS Starter Plan | $79 plan | $12 hosting | 3.2% | 1.0 / month | 3.5% | 72% | Self-serve subscription health |
| DTC Skincare Order | $64 basket | $31 COGS | 3.0% | 0.8 / month | 18.0% | 88% | Repeat ecommerce contribution |
| Marketplace Take Rate | $46 take | $6 ops | 2.4% | 2.4 / month | 6.0% | 66% | Buyer or seller cohort |
| Meal Delivery Basket | $39 order | $24 food | 3.1% | 3.2 / month | 14.0% | 81% | High-frequency local delivery |
| Usage API Account | $210 usage | $48 compute | 2.9% | 1.0 / month | 2.2% | 58% | B2B usage-based revenue |
| Mobile App Subscription | $12 plan | $1.20 store | 15.0% | 1.0 / month | 7.5% | 52% | Consumer paid subscription |
| Agency Retainer | $3400 fee | $1760 labor | 1.5% | 1.0 / month | 4.0% | 90% | Service capacity planning |
| Course Launch Cohort | $580 sale | $96 delivery | 3.0% | 0.18 / month | 28.0% | 75% | Cohort funnel economics |
| Freemium Upgrade Funnel | $24 plan | $5.50 infra | 3.4% | 1.0 / month | 9.5% | 18% | Low activation funnel check |
🧭Unit Economics Health Guide
| Metric | Watch Zone | Healthy Zone | Strong Zone | Meaning |
|---|---|---|---|---|
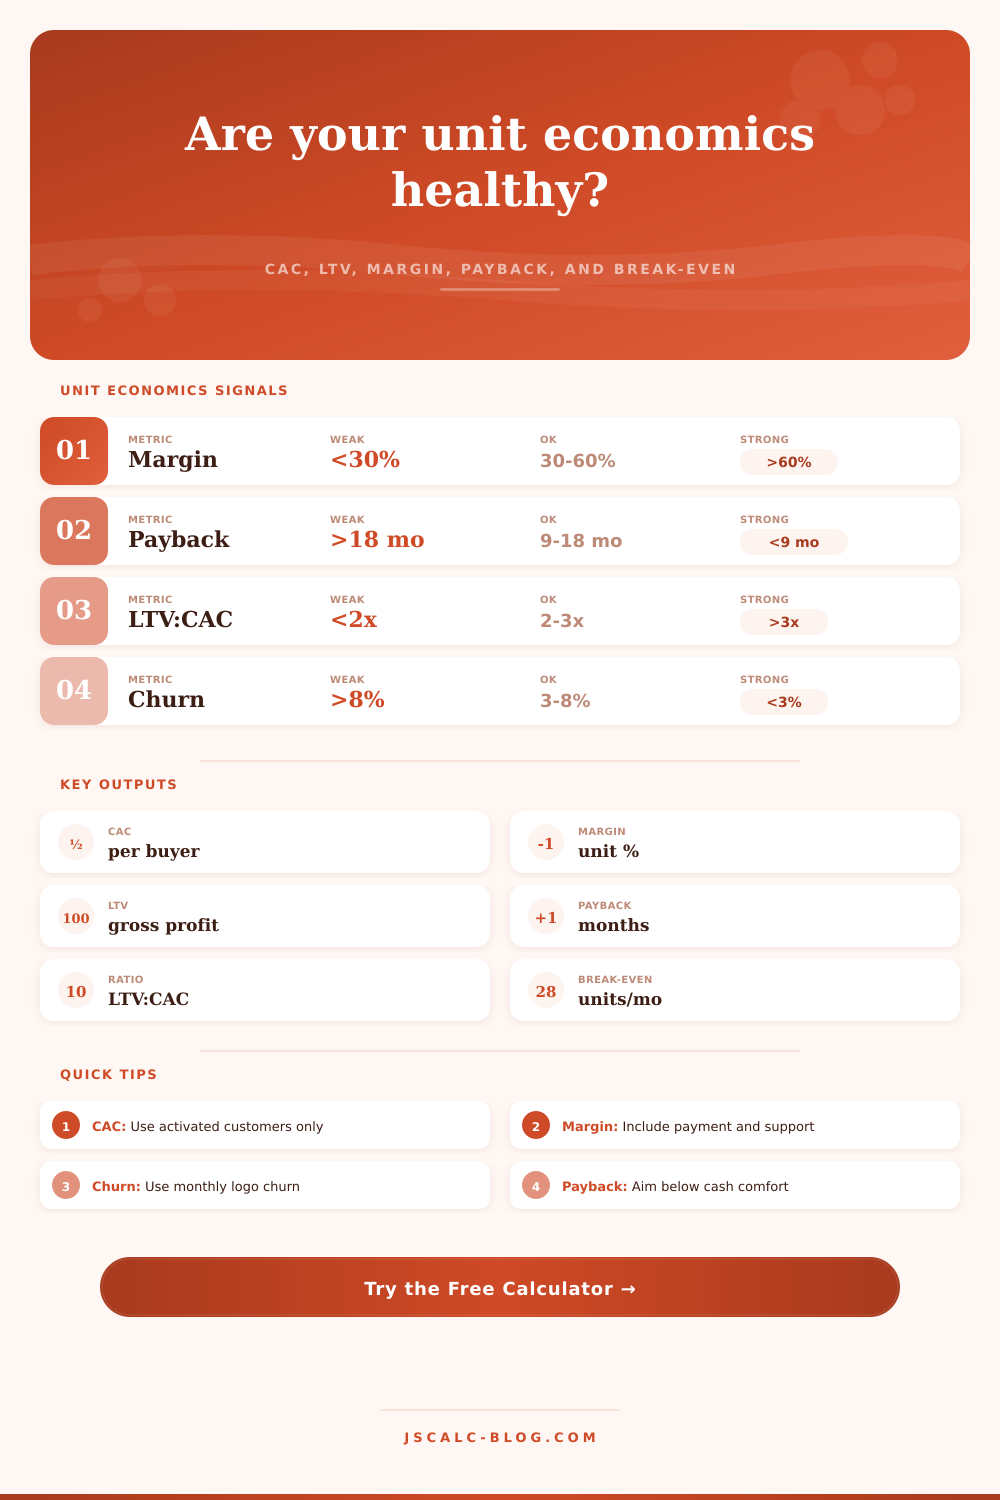
| Contribution margin | Below 30% | 30% to 60% | Above 60% | How much unit revenue remains after variable cost and fees |
| CAC payback | Above 18 months | 9 to 18 months | Below 9 months | How long gross profit takes to recover acquisition spend |
| LTV:CAC ratio | Below 2.0x | 2.0x to 3.0x | Above 3.0x | How much gross profit lifetime value supports each acquired customer |
| Monthly churn | Above 8% | 3% to 8% | Below 3% | How quickly the customer base leaks before expansion |
| Activation rate | Below 35% | 35% to 70% | Above 70% | How much acquired demand becomes paying customer value |
| Break-even volume | Above current capacity | Near planned scale | Below available demand | How many customers or units cover fixed overhead |
⚙Formula Breakdown
📋Common Input Choices
| Input | Use This Value | Avoid This | Why It Matters |
|---|---|---|---|
| Revenue per unit | Net billable revenue before variable cost | Total company revenue | The unit must match the cost and volume inputs |
| Variable delivery cost | COGS, hosting, fulfillment, direct labor | Rent, founder salary, fixed tools | Fixed overhead is handled separately |
| Payment or platform fee | Blended processor, app store, or marketplace fee | Ignoring fees for small tickets | Fees can move margin sharply at low prices |
| Acquired customers | Cohort from one channel or campaign | All historical customers | CAC is clearest when the spend and cohort match |
| Activation rate | Paid and usable customers after screening | Email leads or trial starts only | Raw leads understate CAC per real customer |
| Churn | Monthly logo churn for the same customer unit | Annual churn entered as monthly | Monthly churn drives lifetime directly |
| Expansion | Net monthly upsell or repeat order lift | One-time launch boost | Expansion offsets churn in the LTV estimate |
| Overhead | Fixed cost the unit pool must cover | Costs already in variable inputs | Double counting makes break-even too high |
💡Practical Unit Economics Tips
Do you remember how some businesses appear great on paper but seem to be hemorrhaging money out of bank account? Yup, that’s typically a unit economics issue.
At the top level, most founders is obsessed with either total revenue (a vanity metric) or gross profit. If the math underneath doesn’t add up, then they’re focusing on the wrong thing. The calculator above will calculate exactly what math should look like, and learning the levers behind why numbers goes up and down is where the real leverage is. It is not so much the act of plugging things into the calculator itself. You see the skeletal structure of your business model underneath all of vanity metrics.
How to Check if Your Business Makes Money
People make mistake (first) of mixing up profit with revenue. Yes, revenue’s simple. Profit are revenue minus the cost of the thing you just sold. Subscription software includes the payment processing fee, the hosting cost and the support team time spent making sure that single user stays happy. For e-commerce, these is the product cost, the packaging, and the shipping. If you’re not netting those variable costs off your price, you’re not computing margin, you’re computing hope.
The tool makes you account for money you spend on support labor, often missed, yet able to steal a quiet ten percent out of your margin. And it makes you account for payment fees, too. Those are the things people miss, they look at the gross margin and forget about unseen loss.
After you’ve got your contribution margin, now look at what it costs to acquire a customer. What’s called your Customer Acquisition Cost isn’t just what you spend on advertising. It’s what you spent overall, divided by how many customers you actualy acquire. So if you spent five thousand dollars in advertising and got fifty signups, but only twenty bought, then your customer acquisition cost was two hundred and fifty dollars, more than one hundred dollars. The calculator does this for you so you don’t have to guess. Just plug in your activation rate and let the calculator do the math.
Most teams fail here because they divides their ad spend by leads or clicks. This will inflate your perception of your own efficiency. It also masks the fact that you’re losing value from your funnel before it reach the bank account.
The flip side is Lifetime Value. This isn’t some crystal ball prediction, it’s the statistical average of your customers’ spending, multiplied by their duration. The killer is churn. At a three percent per month churn rate, you will lose about one-third of your customers annually. If your churn is worse then that, your window for earning back your acquisition cost gets really small. You also has less time to do so.
The page lays it out clearly in its reference table: You need to keep your churn below three percent to have a strong business. Above eight percent? You’re pouring water into a leaky bucket. If the hole is larger than the stream, it doesn’t matter how fast you pour.
Compare Customer Acquisition Cost to Lifetime Value. This is the holy grail. Smart operators (and investors) look for three to one, minimum. Below two, you’re effectively spending more to acquire a customer than they bring in to you. You are racing to the bottom. The fix: increase prices or decrease costs, do it fast.
Payback period is equally important. You should of recoup your acquisition spend in under twelve months, preferably under six. Anything longer than that kills cash flow, despite the attractive long-term LTV. Technically you’ll reach profitability in year three, but you’ll burn through your runway by month eight.
The last reality check is what I call break-even volume. It’s the number of customers required to pay for your fixed overhead. Your variable margin doesn’t impress rent, salaries, insurance or software tools. They all requires monthly payment. Your break-even volume should never exceed your ability to fulfill or sell. Scaling up isn’t a remedy for bad unit economics. Bad units don’t scale away, fixing the unit has to come first. After that, it’s a simple multiplication problem. Before that, it’s simply a larger loss.
But this isn’t perfection, it’s direction. It’s whether you’re creating a business or if you’re creating a cost center. You must get the inputs right so that you can see how the outputs change. Make decisions based off reality instead of revenue hype. Focus first on the margin. Work on the churn. Only after those are under control should you increases spend on acquisition.
The numbers do not lie, but they also won’t wait for you to look at them in the right way.