Cost of Goods Sold Calculator
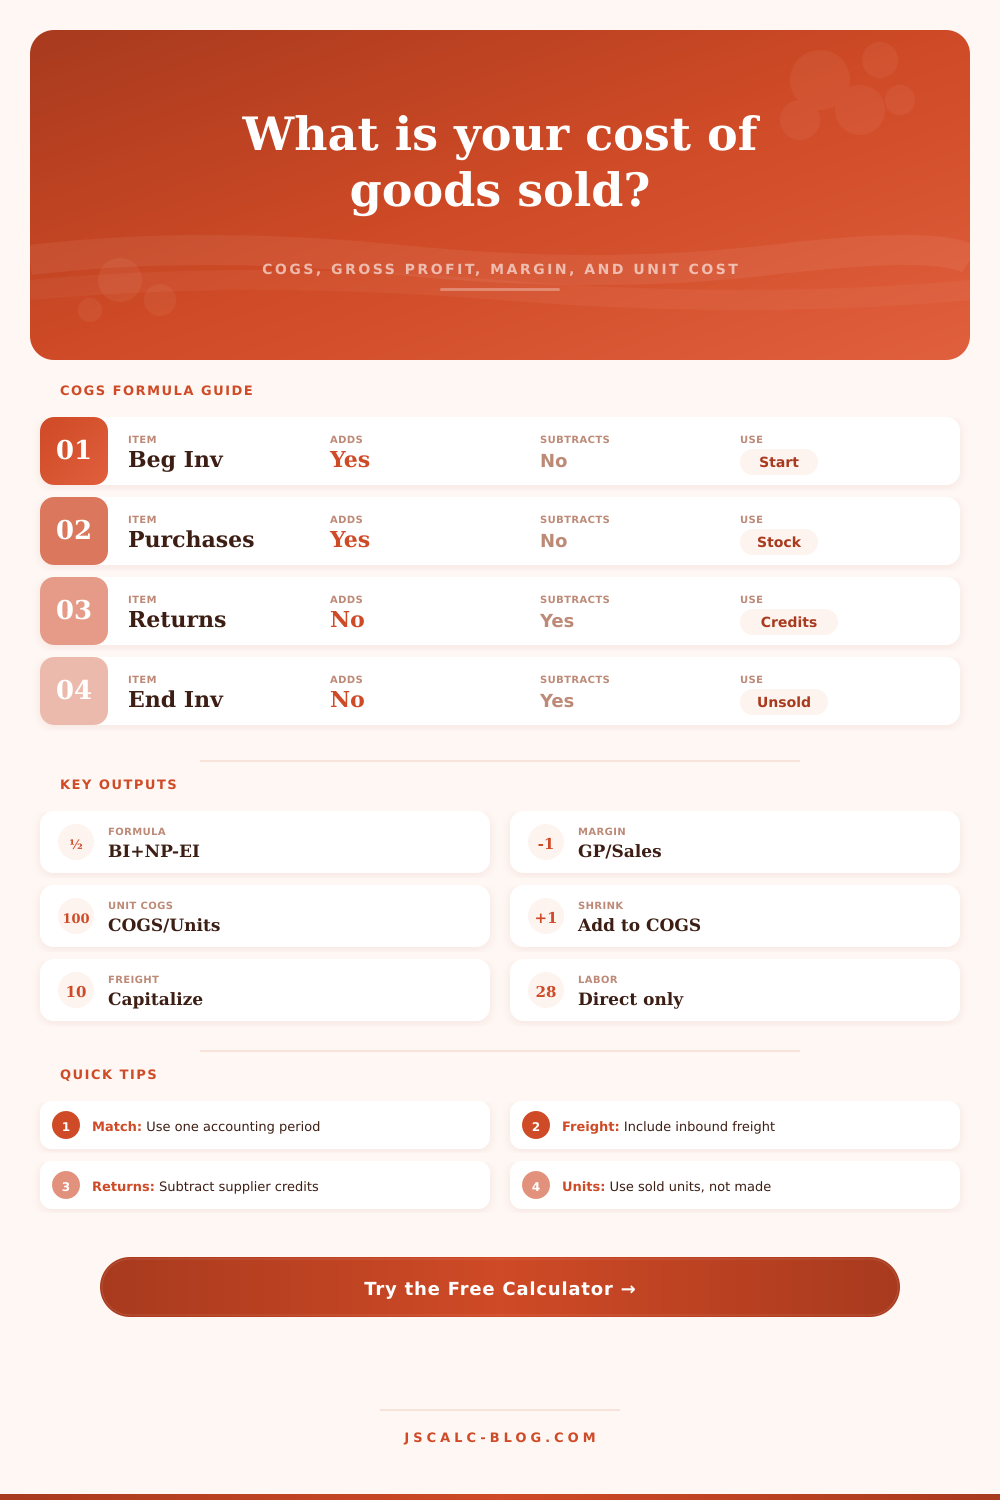
Calculate COGS from opening inventory, net purchases, direct labor, overhead, shrinkage, and ending inventory. The tool also estimates gross profit, gross margin, cost per unit sold, inventory turnover, and the formula trail for the period.
📌COGS Scenario Presets
🧮Inventory and Sales Inputs
Updates the reference cards and suggested shrinkage range.
Use matching inventory and sales cutoffs for the same period.
The calculator reports the method label; enter inventory values already measured by that method.
Manufacturing overhead belongs in product cost when it is inventory-related.
Inventory on hand at the start of the period.
Supplier purchases, raw materials, or goods available for resale.
Freight-in, import duty, receiving fees, and landed-cost add-ons.
Supplier credits reduce net purchases for the period.
Use production labor, kitchen prep labor, or assembly labor when applicable.
Rent, utilities, indirect supplies, and equipment costs tied to production.
Add normal shrink, expired goods, damage, and inventory count losses.
Inventory still on hand at the end of the same period.
Physical sold units, meals, boxes, cases, or finished goods shipped.
Sales after customer refunds, allowances, and discounts.
Used to show required sales for the entered COGS level.
Optional unit count helps estimate average inventory value per unit.
Use the counted ending units for inventory turnover context.
📊Current COGS Snapshot
🗂Business Pattern Reference
📘COGS Formula Breakdown
📋COGS Component Reference
| Component | COGS Direction | Common Source | Include When | Avoid Mixing With |
|---|---|---|---|---|
| Beginning inventory | Add | Prior close balance | Goods were available for sale at period start | Current purchases ledger |
| Gross purchases | Add | Supplier bills | Inventory was bought for resale or production | Operating supplies |
| Inbound freight | Add | Freight-in invoices | Freight is needed to acquire sellable stock | Outbound shipping |
| Purchase returns | Subtract | Vendor credits | Goods were returned or discounts reduced cost | Customer refunds |
| Direct labor | Add | Job or batch labor | Labor transforms materials into sellable goods | Admin payroll |
| Production overhead | Add | Cost allocation | Overhead attaches to manufactured inventory | Selling expense |
| Normal shrinkage | Add | Inventory counts | Losses are normal spoilage, breakage, or shortage | Unusual loss analysis |
| Ending inventory | Subtract | Physical count or perpetual ledger | Goods remain unsold at period end | Future-period COGS |
⚙Inventory Method Comparison
| Method | Best Fit | COGS Effect When Costs Rise | Ending Inventory Effect | Calculator Input Note |
|---|---|---|---|---|
| Weighted average | Interchangeable items | Middle of FIFO and LIFO | Smoothed unit cost | Use average-cost inventory balances |
| FIFO | Perishable or chronological goods | Lower COGS in rising-cost periods | Higher ending inventory | Value ending units from newer layers |
| LIFO | Tax or internal flow in some systems | Higher COGS in rising-cost periods | Lower ending inventory | Use LIFO layer balances where allowed |
| Specific ID | Unique or high-value items | Depends on actual sold items | Specific remaining cost | Enter traced cost of sold and ending goods |
| Standard cost | Manufacturing controls | Depends on variance handling | Standard plus capitalized variances | Include assigned purchase or production variances |
| Retail method | Retail estimate close | Estimate based on cost ratio | Estimate based on retail ending stock | Enter converted cost-value inventory balances |
📦Preset Input Benchmarks
| Preset | Beginning Inv. | Gross Purchases | Other Adds | Credits | Ending Inv. | Units Sold | Net Sales | Typical Use |
|---|---|---|---|---|---|---|---|---|
| Retail Quarter | $42,500 | $68,500 | $4,070 | $1,850 | $39,750 | 6,120 | $142,000 | Merchandise close |
| Bakery Week | $3,250 | $8,900 | $5,590 | $420 | $2,880 | 3,400 | $24,750 | Food production |
| Manufacturer Month | $118,000 | $176,500 | $126,500 | $5,200 | $141,500 | 18,400 | $492,000 | Factory output |
| Ecommerce SKU Batch | $12,400 | $31,200 | $3,280 | $1,150 | $9,650 | 4,850 | $79,600 | Landed resale |
| Restaurant Month | $9,800 | $44,500 | $21,180 | $980 | $10,700 | 12,900 | $126,500 | Menu COGS |
| Craft Shop Run | $5,600 | $13,850 | $12,050 | $300 | $4,950 | 1,260 | $43,800 | Made-to-sell run |
| Produce Harvest | $2,900 | $17,600 | $22,200 | $0 | $3,800 | 28,000 | $63,500 | Harvest batch |
| Subscription Box Cycle | $27,400 | $82,000 | $16,240 | $2,600 | $24,900 | 14,200 | $198,800 | Box assembly |
| Wholesale Distributor | $210,000 | $540,000 | $21,500 | $12,000 | $235,000 | 46,000 | $718,000 | Case shipments |
🔎Margin and Turnover Reading
| Metric | Formula | Healthy Signal | Review Signal | What To Check |
|---|---|---|---|---|
| Gross margin | Gross profit / sales | Stable against prior periods | Sudden drop | Supplier cost, discounting, or shrink |
| COGS ratio | COGS / sales | Lower than planned ceiling | Above expected range | Input cutoff and ending count |
| Unit COGS | COGS / units sold | Close to recipe, BOM, or buy cost | Higher than standard | Freight, labor allocation, spoilage |
| Inventory turn | COGS / avg inventory | Matches product velocity | Very low or unusually high | Dead stock or count errors |
| Markup on cost | Gross profit / COGS | Supports target margin | Below pricing model | Selling price and promotions |
| Unsold share | Ending inv. / goods available | Consistent with reorder cycle | Large buildup | Demand forecast and stock aging |
💡COGS Close Tips
Prioritize cost of making product over spending money on marketing Before small business owners obsess about marketing spend, they should of first prioritize the cost to make their product. Reconciling invoices and counting boxes seem like a boring, cold administrative chore. But it’s here where profit gets lost in the boredom.
Cost of goods sold isn’t simply an accounting entry. It reflect whether your business model is working, or if you’re moving costly air around. You might be able to sell a thousand units of a product. Without tracking what goes into each unit (labor, materials, shrinkage), you’re flying blind.
Put Making Costs Before Marketing Costs
Once you input your sales data and inventory levels, the calculator above do the math for you. It saves you the guesswork on conversions and coefficients. It sounds so obvious, but the nuts and bolts of what’s included in this equation are important. For example, do you account for import duties? Do you account for inbound freight? Those is common mistakes.
If not, then the product appears more affordable then it truly is. Again, it’s small, but it counts. Not accounting for the cost of bringing products to your doorstep can make your gross margin appear strong on paper, yet leave your bank account stagnant. The calculator includes fields for those landing costs. Whatever the real cost per unit is to get products out the door, that are our final figure.
Another tripwire is labor. Any direct labor associated with making or assembling product goes into cost of goods sold. For example, time spent by workers mixing batter or sanding tables is a product cost. Time spent by those same workers managing social media or answering phones is an operating expense. Mixing these two types of categories distorts your margins. To know how efficiently you’re working, you must keep production costs separate from overhead.
The chart on the page lay it out for you: what goes into COGS and what doesn’t. Knowing the difference will help you price accordingly, as well as find places where waste may be hiding in your process.
Shrink is the ghost in the machine. That’s the inventory which goes missing somewhere between shelf and the sales register because it was damaged, stolen, or spoiled. Most businesses expect some shrink to happen as part of doing business. With the tool, instead of pretending shrink doesn’t exist until year-end, you can build it into the picture.
Perishable food sells? Of course there’ll be some spoilage. Electronics sell? Maybe theft is the larger risk. In either case, it is a cost of doing business. It need to be counted in the same period in which it happens.
When you ignore shrink, you’re creating a false sense of security. You’ll end up with less inventory on hand than your ledger anticipates, and that discrepancy is money you’ve already lost.
This entire system has a pulse check: inventory turnover. Inventory turnover indicates the speed at which you’re turning over stock. If it’s high, that typically means you’re keeping your cash flow tight and selling items fast. Low turnover indicate either falling demand or overstocking. You need sufficient stock to fulfill demand but not tie up too much capital with boxes that won’t move.
This ratio is automatically computed by the calculator. Use it as a benchmark to compare yourself to industry standards. It’s not only how much you sell; it’s also how efficiently you use your inventory to generate those sales. And all that hinges on this: how much does each one cost?
If you don’t know what something costs, you can’t price it with any confidence. You will have no way to ensure you’re covering your costs and making a profit. And even if you’re off by just a bit, that could wipe out your margin completly. So aim to get every cut-off, from initial inventory through to final count, lined up.
When the numbers add up then the story they tell has to be right. Because when the story’s right, you’ve gone from a mass of receipts to a clear picture of profitability. You will use these profit and loss figures to confidently buy, sell and grow your business.
It’s basic math, yet the willpower to actualy follow it is what divides the businesses that thrive from those that struggle.