Marginal Cost Calculator
Calculate marginal cost from a direct change in total cost or build it from variable drivers, yield loss, fixed step cost, and capacity surcharges. Results show the cost per added unit plus a full formula breakdown.
🎯Marginal Cost Presets
🧮Production Change Inputs
Direct mode uses actual accounting totals. Build-up mode estimates the added cost from drivers.
Context adjusts interpretation labels and benchmark guidance.
Used only for display; formulas are unit-neutral.
The denominator in marginal cost per added output.
Output before the change.
Output after adding volume.
Total cost at Q1.
Total cost at Q2.
Raw material, ingredients, compute, or direct consumables.
Hands-on labor, support, technician, or operator time.
Power, hosting, machine time, fuel, or similar variable use.
Quality checks, packing, transaction handling, or dispatch work.
Only include overhead that changes with volume.
If 96% yield, 250 good units require about 260 input units.
Setup, batch changeover, temporary lease, supervisor block, or license block.
Added output covered without overtime or expedited handling.
Overtime premium, rush handling, overflow compute, or extra route cost.
Rounding changes display only; breakdown keeps the raw math.
🔢Current Cost Snapshot
📋Marginal Cost Formula Steps
🧭Cost Driver Reference Grid
📊Scenario Benchmarks
| Context | Typical Marginal Drivers | Step Cost Trigger | Yield or Rework Issue | Useful Output Unit |
|---|---|---|---|---|
| Manufacturing units | Material, machine time, direct labor, scrap | Tooling setup, extra shift, temporary supervisor | Defects, rework, line startup waste | Finished units |
| Food or beverage servings | Ingredients, prep labor, packaging, utilities | Batch changeover, added prep station | Spoilage, portion loss, remake rate | Servings |
| Print or packaging pieces | Stock, ink, plates, press time, finishing | Make-ready setup, die change, rush shift | Misprints, trim loss, press rejects | Pieces |
| Service appointments | Technician minutes, supplies, room turnover | Extra provider block or temp room | No-show buffers, repeat visits | Appointments |
| Software users or jobs | Compute, storage, support load, transaction fees | License tier, new instance, support pod | Failed jobs, retries, support rework | Users or jobs |
| Delivery stops or shipments | Driver time, fuel, handling, route distance | Extra vehicle, route split, dispatch block | Failed delivery, returns, repacking | Stops |
| Course seats or enrollments | Materials, platform seats, grading support | New cohort, instructor block, room limit | Dropouts, resubmissions, makeups | Seats |
| Lab tests or samples | Reagents, technician time, consumables, machine run | Batch setup, calibration, overtime slot | Invalid samples, retests, control failures | Tests |
📝Preset Comparison Table
| Preset | Method | Q1 to Q2 | Added Output | Main Driver | Marginal Cost Signal |
|---|---|---|---|---|---|
| Bakery Extra Batch | Build-up | 400 to 520 | 120 servings | Ingredients plus yield | Stable variable cost |
| SaaS User Support | Build-up | 12000 to 13500 | 1500 users | Support and platform usage | Low per-user cost |
| Print Shop Run | Direct | 3000 to 5000 | 2000 pieces | Actual job totals | Make-ready spread out |
| Delivery Route Add-On | Build-up | 80 to 112 | 32 stops | Driver time and excess stops | Capacity surcharge |
| Widget Overtime Shift | Build-up | 1800 to 2300 | 500 units | Labor premium and scrap | Rising marginal cost |
| Cafe Lunch Rush | Build-up | 210 to 285 | 75 orders | Food, packaging, temp labor | Moderate added cost |
| Data Center Jobs | Build-up | 50000 to 62000 | 12000 jobs | Compute and retry load | Very low unit cost |
| Clinic Appointments | Direct | 96 to 116 | 20 appointments | Actual weekly totals | Provider block added |
| Course Seats | Build-up | 48 to 72 | 24 seats | Instructor block and materials | Step cost sensitive |
⚖Reading Marginal Cost Results
| Result Pattern | Likely Cause | Accounting Check | Planning Read |
|---|---|---|---|
| Marginal cost below average cost | Fixed costs are being spread over more units | Confirm no deferred step cost was missed | Added volume lowers average cost |
| Marginal cost near variable unit cost | Capacity is available and yield is stable | Check that only changing overhead is included | Expansion is within normal range |
| Marginal cost above average cost | Overtime, scrap, rush handling, or step cost | Trace the largest driver in the breakdown | Extra output strains capacity |
| Negative marginal cost | Data entry issue, rebate, credit, or cost reversal | Audit TC1 and TC2 timing | Do not treat as a normal production signal |
| Large jump at a small quantity change | Fixed step cost is spread over too few units | Separate recurring and one-time costs | Try a larger Q2 scenario |
| Yield-adjusted cost much higher | Good units require many input attempts | Review scrap and rework logs | Quality improvement may lower MC |
💡Marginal Cost Tips
Sometimes you’re tempted to add one more hour to the production schedule, except you suspect doing so will cost you more than the additional revenue it generates. Most of the time, that’s right: Your gut knows best, but your gut isn’t going to survive a close-up by the budget police or in the board room. You’ve got to prove your hunch with numbers.
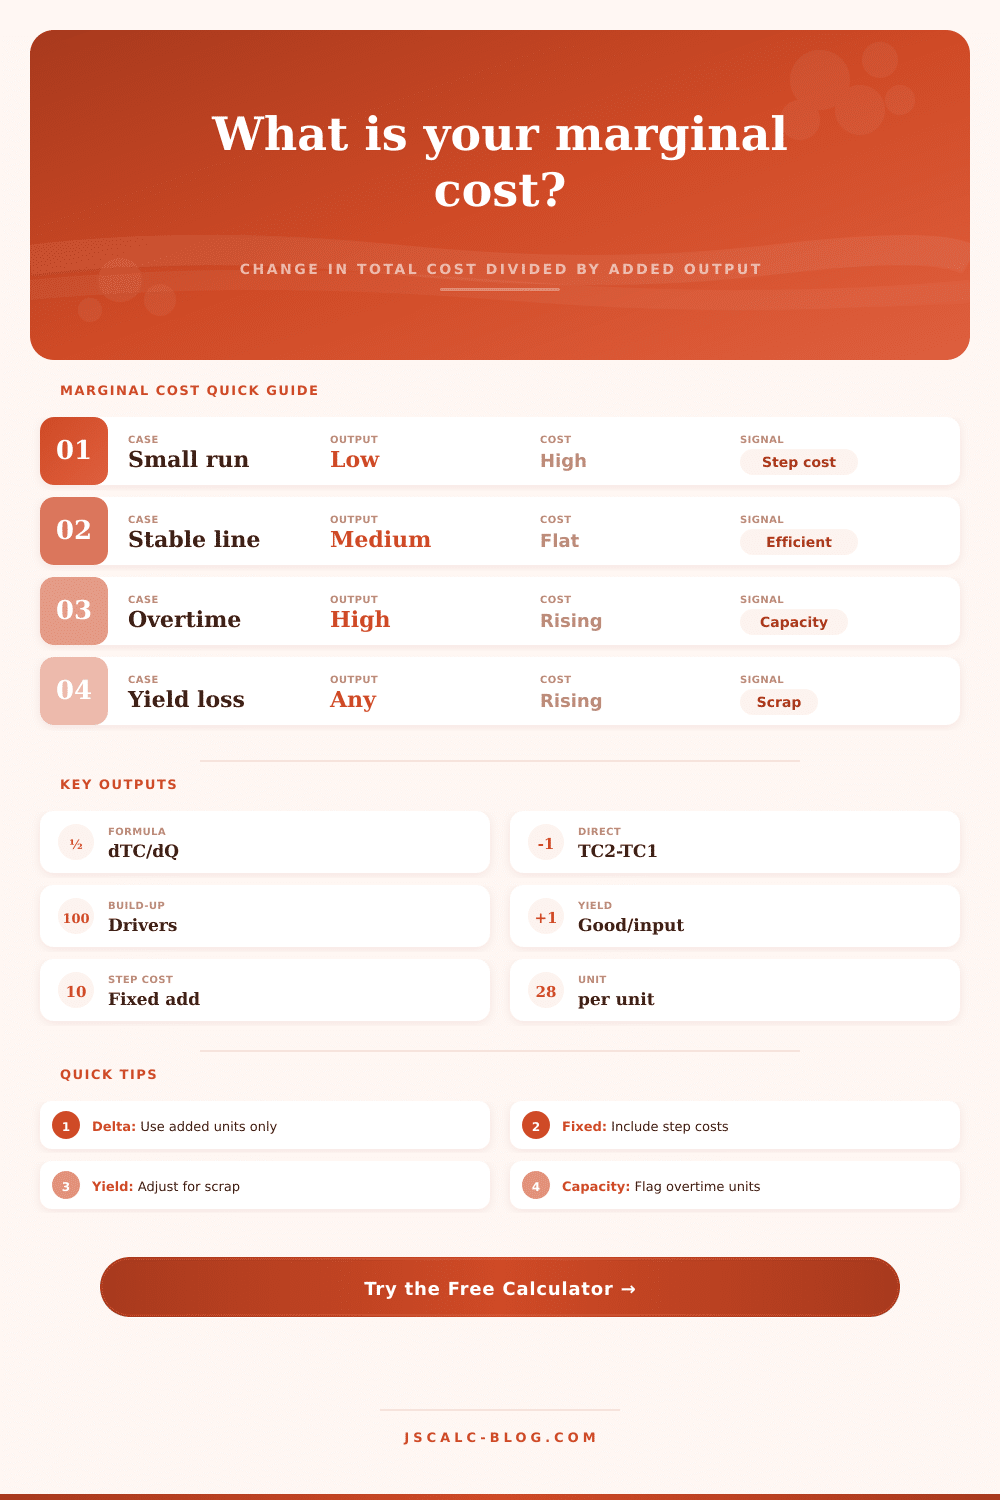
The number that connects your ledger to your intuition is marginal cost, which measure the cost of producing the very next unit, not the (averaged) cost of everything produced thus far. That’s what most folks see, they go right to the direct calculation. That’s the total cost before and after the change. Subtract one from the other. Divide by the number of new units. It is clean and simple, if you have those accounting numbers handy, the calculator above will do the math for you.
What Is Marginal Cost?
But production isn’t nearly so neat in reality. What makes it tricky is that costs don’t necessarily follows a straight-line path. They jump up. They dip down. They hide inside yield loss that shows up only when production are pushed harder.
But it’s there that the build-up strategy kicks in. Rather than assuming one total, you break apart the cost of producing that additional output and the raw drivers of that cost. What materials is required to create only those extra units? How many extra hours does it take your staff to make the shift longer? What’s the spike in energy consumption? In doing so, you force yourself to see what realy shifts when you crank up production.
Ignore the step costs and you’ll price yourself right out of business. Ignore the yield, and you might look good on paper… But you will bleed cash in the warehouse.
Take a bakery that decides to make one more batch of bread. Inputs like yeast and flour are clear. What about the slightly increased burn rate on oven? There is a tiny probability that a loaf will collapse. Those little variables accumulates. The tool allows you to parse those out.
And it also allows you to tweak for yield, because not all inputs result in sales. If only 96 of your inputs turn into sales but you’re still paying for 100, that 4% difference is eating away at your margins with each scale-up.
Capacity constraints are the silent killers of profit. Sure, there may be acres of factory floor available for you, but what about your supervisor’s time? Or are there limits to the number of licenses on that software platform? Once you hit a threshold, the cost of the next unit can jump overnight. Such a step cost. Costs stays fixed until they do not. Model these jumps on the calculator and see where they occur, where the economics of increased volume go from favorable than disastrous.
A variable cost and a marginal cost is similar but distinct. A variable cost is the cost of producing one unit under normal circumstances. A marginal cost is the cost of producing the next unit under current circumstances. Does this mean marginal cost incorporates premium pay if you’re working overtime? Sure. What about rush fees if you’re pushing up against your storage capacity? Of course.
Why does it matter? Because pricing by average costs frequentely fails at the edges. You may take an order that seems profitable on average. However, it can burn through cash if it pushes you into overtime or requires scrap.
The math takes some sleuthing to read. It is good news if the marginal cost is less than the average total cost. This means you are taking advantage of economies of scale by spreading those fixed costs over more units. Bad news if it’s shooting up higher then the average (quality problem?) You might have hit a capacity wall. And the only time a marginal cost can be negative is when there’s some sort of data error, maybe a credit or rebate that didn’t time well with your production numbers.
Marginal cost is ultimately an exercise in honesty. When done right, it makes you see what something actualy costs. It removes the comfort that comes with using the average.
And whether you’re expanding a course by adding seats or increasing your delivery routes by stopping at new locations, it’s the same thing. Don’t add without knowing the cost of the next step. Then, when opportunity knocks, you’ll of be able to see whether it’s worth the price of admission.