Startup Runway Calculator
Estimate how many months your startup can operate before reaching a cash floor. Model starting cash, recurring revenue, gross margin, operating expenses, growth assumptions, one-time cash events, and a target reserve.
🎯Startup Runway Presets
🧮Runway Inputs
The symbol changes display only; values are not converted.
Profile changes guidance wording and benchmark comparisons.
Use available cash, excluding signed deals not yet collected.
The runway clock stops when projected cash reaches this floor.
Use recognized or reliably collected monthly revenue.
Gross profit equals revenue multiplied by gross margin.
Include payroll, tools, rent, contractors, marketing, and admin.
Enter expected month-to-month MRR growth after churn.
Use negative values for a planned expense reduction.
Optional bridge, grant, customer prepay, or committed close.
Month number when the added cash is expected to land.
Upfront hires, deposits, audits, inventory, launch work, or severance.
📊Current Runway Snapshot
📐Formula Breakdown
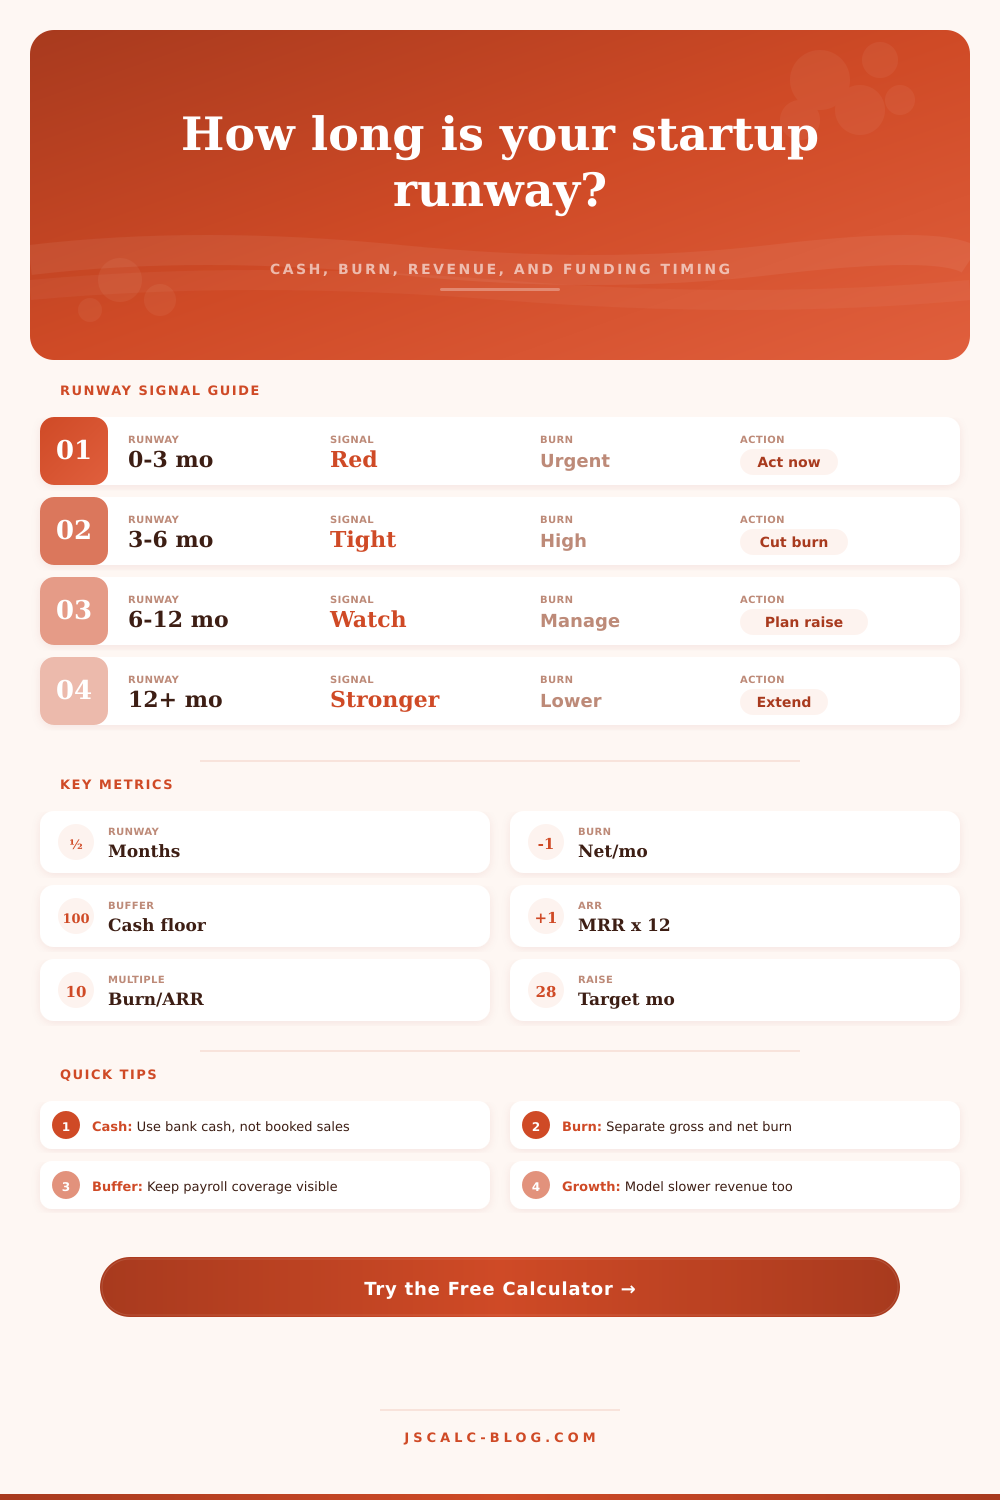
🧭Runway Signal Reference
| Runway Range | Planning Signal | Typical Finance Read | Useful Check | Common Move |
|---|---|---|---|---|
| 0 to 3 months | Critical | Cash decision window is already compressed | Weekly cash receipts and payroll dates | Immediate financing, cuts, or collection push |
| 3 to 6 months | Tight | Little room for missed revenue or slower collections | Confirmed cash inflows versus expected bookings | Reduce burn and lock a near-term plan |
| 6 to 12 months | Manageable | Enough time for a raise process or operating reset | Milestones before the next capital event | Plan financing 4 to 6 months ahead |
| 12 to 18 months | Healthy | Runway supports focused execution and iteration | Burn multiple trend and growth quality | Invest selectively in proven channels |
| 18+ months | Strong | Flexibility is high if assumptions stay realistic | Cash conversion cycle and hiring pace | Preserve optionality while scaling |
| 60+ months | Sustainable | Projected cash stays above reserve in this model | Whether growth and margin assumptions are grounded | Recheck model with a conservative case |
💼Startup Profile Benchmarks
| Profile | Common Revenue Input | Typical Gross Margin | Burn Watch Item | Runway Sensitivity | Best Calculator Use |
|---|---|---|---|---|---|
| SaaS subscription | MRR or committed monthly subscription | 70% to 90% | Hiring before retention proof | Churn and expansion drive net burn | Model MRR growth and margin together |
| Marketplace | Net revenue after take rate | 60% to 85% | Subsidies, incentives, and support | Volume may grow while cash drops | Use conservative revenue growth |
| Hardware | Collected gross profit from shipped units | 25% to 55% | Inventory deposits and production runs | One-time spend can dominate cash timing | Add pilot or tooling spend explicitly |
| Services to product | Recurring retainers plus product revenue | 35% to 70% | Founder delivery time and contractors | Margin mix changes as product grows | Update margin as revenue mix shifts |
| Consumer app | Subscription, ads, or in-app revenue | 50% to 85% | Paid acquisition and creator spend | Marketing scale can shorten runway fast | Stress test expense growth |
| Deep tech or R&D | Grants, pilots, or staged contracts | 0% to 60% | Lab, compliance, and technical staff | Milestone delays can shift cash sharply | Use inflow month for grant timing |
| Enterprise sales | Recognized subscription or services MRR | 60% to 90% | Long cycles and implementation effort | Cash collection timing matters | Run downside cases for delayed closes |
🔢Preset Scenario Table
| Scenario | Cash | Reserve | MRR | Margin | Expenses | Rev Growth | Expense Growth | Special Cash Event |
|---|---|---|---|---|---|---|---|---|
| Bootstrapped SaaS | $220K | $35K | $42K | 86% | $58K | 4.0% | 0.5% | No added cash |
| Seed Hiring Plan | $1.8M | $300K | $95K | 78% | $285K | 6.5% | 3.5% | $0 added |
| Pre-Revenue MVP | $420K | $75K | $0 | 75% | $92K | 0.0% | 1.0% | $0 added |
| Hardware Pilot | $680K | $120K | $35K | 42% | $115K | 8.0% | 2.0% | $160K month 5 |
| Marketplace Launch | $950K | $180K | $60K | 64% | $205K | 9.0% | 4.0% | $0 added |
| Agency to Product | $310K | $50K | $72K | 48% | $82K | 2.5% | 0.0% | $40K month 4 |
| Bridge Round Scenario | $260K | $80K | $28K | 80% | $88K | 5.0% | 1.0% | $500K month 4 |
| Burn Reduction Plan | $540K | $110K | $55K | 83% | $140K | 3.0% | -4.0% | $0 added |
| Enterprise Ramp | $1.2M | $220K | $110K | 72% | $240K | 7.5% | 2.0% | $200K month 7 |
🔍Burn Multiple Reading
| Burn Multiple | Formula | Efficiency Read | Common Interpretation | Check Before Acting |
|---|---|---|---|---|
| Negative or 0x | Net burn at or below zero | Cash-generating | Revenue gross profit covers operating expense | Confirm collections and one-time items |
| 0x to 1x | Annual net burn below ARR | Efficient | Each ARR dollar needs less than one dollar of annual burn | Quality of growth and retention |
| 1x to 2x | Annual net burn near ARR | Moderate | Often acceptable if growth is strong and intentional | Payback, sales cycle, and hiring pace |
| 2x to 3x | Burn is several times ARR | High | Runway depends heavily on capital or fast growth | Milestones before the next raise |
| Above 3x | Burn much larger than ARR | Aggressive | Useful only with clear proof points or deep capital plan | Scenario model for slower revenue |
| No revenue | ARR equals zero | Not defined | Use gross burn runway and milestone timing instead | Prototype, launch, or pilot deadline |
💡Runway Planning Tips
Most startups obsessively measure their own metrics: churn rate, revenue. But most founders don’t know how many more month of cash they have left.
Why? Because while there’s a static number (the amount of money in the bank), your runway fluctuates based off closing deals, launching campaigns, hiring employee. That’s what the calculator does for you. Plug in your variables and it tells you whether taking on that new hire will make a difference, extending or shortening your timeline.
Why You Need to Track Your Startup Runway
This is your cash floor. Most folks divide their overall cash by their monthly burn rate to estimate their runway. That’s dangerously simplistic. You’ll never spend all your dollars before something go wrong. You need a buffer for payroll taxes and depositing with vendors. By letting you set an amount of untouchable cash (your minimum reserve), it give a more realistic expiration date. As long as your projected cash doesn’t dip below this floor, the clock freezes. So you plan your next raise well before you’re out of money. Investors only gets worried when you have time to plan.
Another important metric is the burn multiple. This is your measure of cash burned per dollar of annual revenue generated. Lower = efficient; higher = spending big on growth. We break up the multiples in a reference table by band. But the number isn’t as important than the context. For example, a burn multiple of three could be brilliant if your business is hyper-growth and SaaS. It could be deadly if you’re a mature services business. The question is what’s the growth that comes with the burn?
Not everything grow at the same rate. Expenses aren’t always equal to revenue. Your team grows in chunks. Marketing costs surge when a product launch. You can input those as single events or percentages within the calculator.
Most financial projections rely on linear growth, but startup finances ebb and flow. They’re jagged. If you have a known cash injection (e.g., a grant), enter it into the calculator as an exact event in an exact month. Otherwise you’ll underestimate your runway. The tool will simulate month by month until you reach your reserve level. It uncovers hidden cliffs that you might otherwise miss with linear math.
For pre-revenue startups, there’s an additional twist. Burn multiple is undefined if you have no revenue. Gross burn runway becomes the model. It measures how long it takes for a startup founder’s initial cash to be used up by operating expenses. It is not as forgiving. Think of this as betting on a milestone versus a trend.
Margin reality shows in scenario presets that visualize how inventory cost eats at your timeline. Inventory cost isn’t the same thing as subscription fee for software.
Calculating is the easy part. Optimism is hard. You can easily assume that you’re going to get 10 percent month-over-month revenue growth. That’s easy. Five percent? That’s harder. How about customer churn? Harder still.
Run the calculator twice. Run it once with conservative assumptions and once with an optimistic set of assumptions. One number will be higher than the other. That’s your risk. That’s how flexible you are in case things don’t go right.
Surviving means planning for the downside. Know exactly what you’ll do when it comes time to make a move. It’s all about options. These are options on the runway.
How far away are you from running out of money? That is the runway. And how much wiggle room do you have left to make good decisions? If you’re three months from zero, all of your decisions will be desperate decisions. If you’ve got a year, you can wait for the right opportunity.
Learn to live in that sweet spot. Test your growth assumptions. Make sure your reserve is always in view. Your inputs matter. Be honest in them, because the math is only ever as good as its honesty. How fast does the clock tick? You get to choose.