Burn Rate Calculator
Estimate monthly gross burn, net burn, cash runway, burn multiple, and savings scenarios from startup cash balances or a detailed monthly spend plan.
📌Burn Rate Presets
🧮Cash Flow Inputs
Balance mode uses starting cash, ending cash, and elapsed months for net burn.
The math is currency-neutral; this only changes labels.
Profile changes the runway benchmark and payroll mix comparison.
Scenario cards show the estimated monthly burn after selected reductions.
Cash balance at the beginning of the measurement window.
Cash balance at the end of the same window.
Use 3, 6, or 12 months when cash flows are uneven.
Cash available for future runway from this month forward.
Recurring revenue, grants, retainers, or collected cash per month.
Include salaries, payroll taxes, benefits, contractors, and founders paid in cash.
Rent, tools, insurance, admin, finance, legal, and shared services.
Paid acquisition, events, sales tools, commissions, and demand programs.
Infrastructure, hosting, support delivery, inventory-light COGS, and lab usage.
Average irregular payments across the measurement window.
Optional forward ramp. Enter 0 for a flat-burn runway estimate.
📊Current Burn Snapshot
📋Burn Profile Benchmarks
| Profile | Typical Net Burn | Target Runway | Payroll Share | Watch Closely |
|---|---|---|---|---|
| Bootstrapped | 0 to 25k per month | 6 to 12 months | 35% to 55% | Founder pay and client concentration |
| Pre-seed startup | 20k to 120k per month | 12 to 18 months | 45% to 70% | Hiring pace before product signal |
| Seed-stage venture | 75k to 300k per month | 12 to 24 months | 50% to 75% | Sales capacity vs close rate |
| Series A growth | 250k to 1M per month | 15 to 24 months | 45% to 70% | Go-to-market efficiency |
| Marketplace or commerce | Varies with volume | 9 to 18 months | 25% to 50% | Working capital and refunds |
| Hardware or lab-heavy | 100k to 600k per month | 18 to 30 months | 30% to 55% | Prototype, tooling, and inventory timing |
| Services with product build | 0 to 150k per month | 6 to 15 months | 45% to 75% | Delivery margin and product allocation |
| Turnaround or rescue | Any level | 6 to 12 months | Reset by plan | Immediate cash preservation |
🔎Expense Mix Reference
| Category | Input Field | Included Items | Healthy Pattern | Red Flag Pattern |
|---|---|---|---|---|
| People | Payroll and contractors | Salaries, taxes, benefits, contractors | Largest line, tied to roadmap | Hiring ahead of learning velocity |
| Workspace and admin | Operating overhead | Office, tools, insurance, legal, finance | Stable and reviewed quarterly | Many small tools with no owner |
| Growth | Sales and marketing | Ads, events, sales tools, commissions | Measured against pipeline quality | Spend grows while payback worsens |
| Delivery | Product, cloud, and COGS | Hosting, support, inventory-light COGS | Scales with active usage | Infrastructure climbs faster than revenue |
| Irregular cash | One-time average | Annual software, deposits, equipment | Averaged over 6 to 12 months | Ignored until payment month |
| Cash receipts | Monthly cash inflows | Collected revenue, grants, retainers | Based on received cash | Booked revenue counted before collection |
📈Runway and Burn Multiple Ranges
| Metric | Strong | Watch | Urgent | Calculator Read |
|---|---|---|---|---|
| Flat cash runway | 18+ months | 9 to 18 months | Under 9 months | Cash on hand divided by net burn |
| Fundraise runway buffer | 6+ months beyond raise process | 3 to 6 months | Under 3 months | Compares runway to profile target |
| Burn multiple | Under 1.5x | 1.5x to 3.0x | Above 3.0x | Net burn divided by net new ARR proxy |
| Revenue coverage | 70%+ | 30% to 70% | Under 30% | Inflows divided by gross burn |
| Payroll share | 45% to 70% | 30% to 80% | Outside context range | Payroll divided by gross burn |
| Monthly burn growth | 0% to 3% | 3% to 8% | Above 8% | Compounded in ramped runway estimate |
⚙Formula Method
💡Burn Rate Operating Tips
How fast a startup burns money is called burn rate. In other words: it is the speed at which a startup lose money. Use this term in your planning discussions and board meetings; it’s the yardstick of financial health. Everyone thinks they know what it means until the bank balance stops moving as fast as the bank account say it should.
Plug the numbers into the calculator above to see what we mean; but more important than crunching the numbers, is knowing what they mean (and why). Runway isn’t about revenue, it’s about cash. There is a scary disconnect between when you sign a contract and when the dollars appear in your bank account. Don’t build your runway based off paper promises… Don’t count revenue until the day you recieve payment. Instead, calculate the net burn (the amount of cash that leaves your account each month) by totaling your monthly expenses and subtracting only the amount of cash you’ve collected. It’s a necessary (and brutally honest) separation.
What is Burn Rate and Runway
Net Burn versus Gross Burn: The tool separates these two concepts and lets you see the cash drain vs. The spending machine. How much does it cost to keep the lights on? How long will the lights remain on?
Brewing Up Runway The largest line item is typically payroll. That will be half or more of what you spend each month. Founders fall into this trap, they hire early (ahead of their learning speed). They think they’re going to get more stuff out faster with another engineer. But without any way to pay for it, you’re only speeding up the clock. Model those hires before you even sign the offer with the calculator. Tweak the payroll input field, and see the runway decrease immediately. Pay attention to that. Watch the months tick down from two for every hire. That’s sobering stuff, hidden inside spreadsheets.
Don’t forget the overhead. Your silent tax on the runway include little subscription fees, extra software licensing, and admin expenses that add up. That page has a handy reference table breaking this out by category. It shows how simple it is to get sloppy with spending. A healthy startup checks this each quarter. A struggling one does so when it’s too late (zero bank balance). The tool lets you try out what-if scenarios for savings: reduce marketing spend, pause all hiring. It’s more than numbers. It’s tactical choices about where to slow the business without killing it.
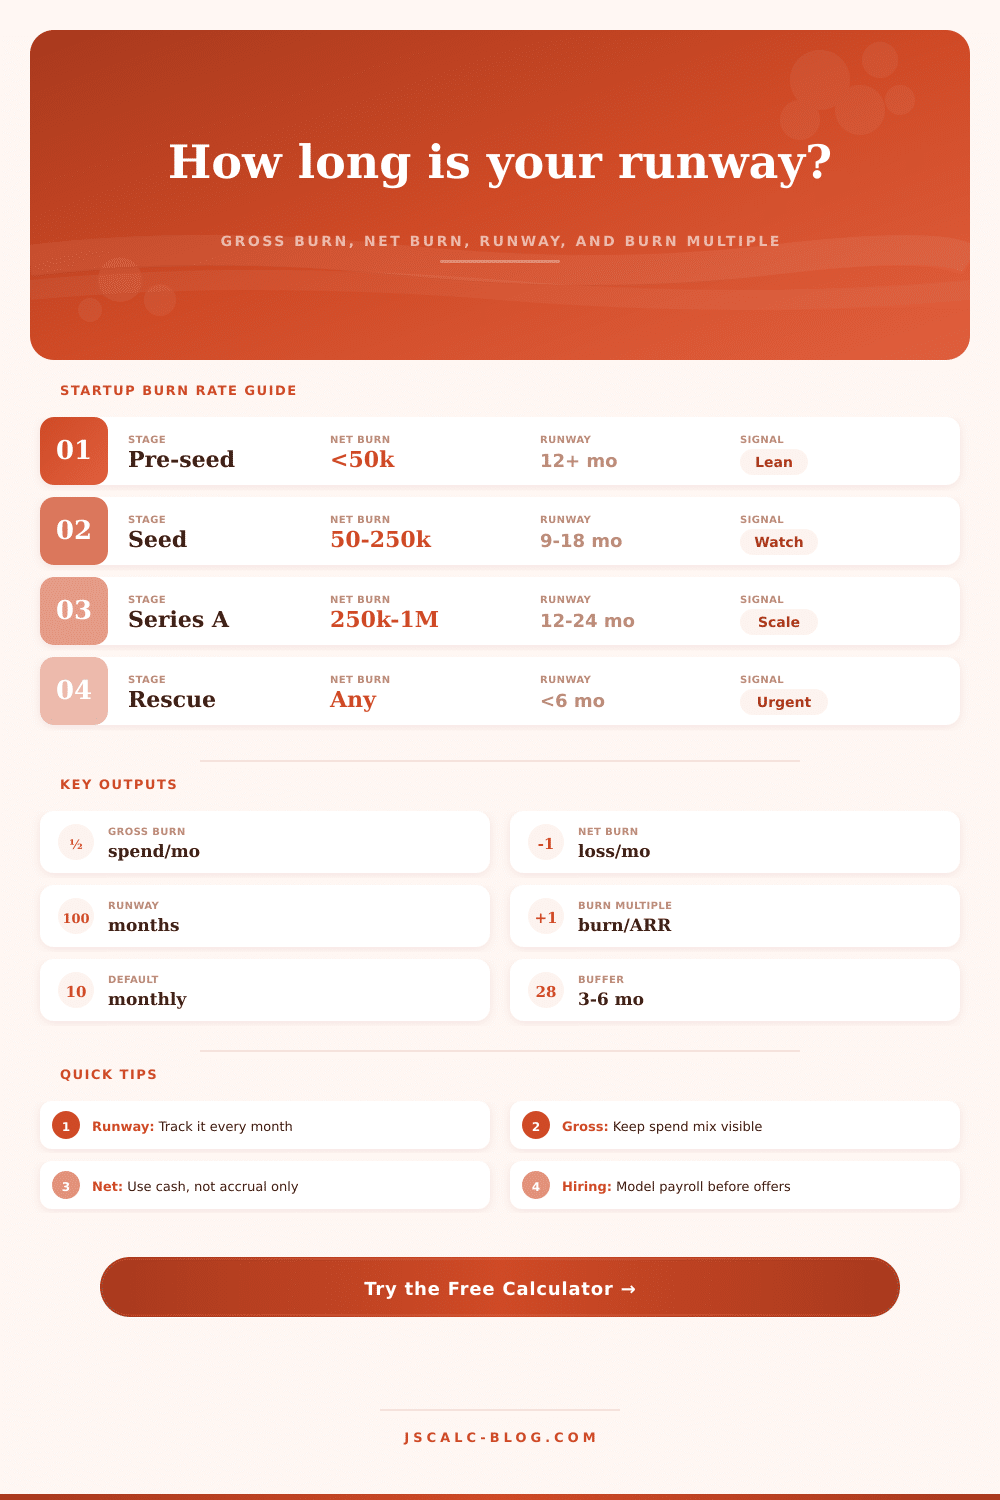
Time to prove the next milestone: this is Runway. In general, investors prefer to see 18 months of cash remaining. Below nine months and you’re in the red zone. You’re raising money while bleeding cash, which kills your leverage.
How does it work? The calculator divides current cash by net burn to get your flat runway. But life isn’t flat. Your costs fluctuate. Growth introduces new spending. To account for the growth in your month-by-month burn, the tool also provides an estimate for your ramped runway. Most startups don’t have static costs. They hire. They spend more on cloud infrastructure. They launch larger ad campaigns. Getting a flat runway estimate can be dangerously optimistic if your burn rate are rising.
Keep an eye on another number: the burn multiple. That’s the ratio between your new annual recurring revenue vs. The net burn. If it’s large, then you’re spending too much money to get each dollar of growth. It tells you if you’re being efficient (or not). Sure, you may be growing like crazy, but if you’re burning through cash at triple the pace of revenue growth, then you’re not actualy scaling. You’re simply consuming.
So what do you do? Lower the multiple while you are still growing. How? You do this by exercising discipline, which means saying no to vanity metrics and yes to unit economics that work. Lastly, understand that your calculator reflects the data you’ve fed into it. A calculator doesn’t know if a key customer will churn or a market suddenly shifts. All it knows is that based off today’s rate of burn, you’re going to run out in X amount of time. Your job: use this tool as a buffer. Aim for twelve to eighteen months of runway. Twelve months minimum. The buffer provides you breathing room to iterate, fail safely, and get to product market fit. Panic won’t help; cash is oxygen. You shouldn’t of realized it until you run out.