Free Cash Flow Calculator
Estimate free cash flow from operating cash flow and capital expenditures, then review margin, cash conversion, FCF per share, debt coverage, enterprise value yield, and a scenario-adjusted forecast.
🎯Free Cash Flow Presets
🧮Cash Flow Inputs
The period label changes annualized reference values.
The profile selects reference bands for margin and CapEx intensity.
Cash provided by operations from the cash flow statement.
Enter purchases of property, equipment, and capitalized software as a positive outflow.
Used for FCF margin and CapEx intensity.
Used for cash conversion quality.
Added back after tax for a rough unlevered FCF view.
Used to estimate after-tax interest adjustment.
Use weighted average diluted shares for FCF per share.
Debt minus cash; negative values represent net cash.
Used for FCF yield; leave at 0 if not applicable.
Applies a simple one-period projection to current FCF.
Splits total CapEx into maintenance and growth portions.
Only changes result display, not the calculations.
📌Current FCF Snapshot
📘Formula Breakdown
📊Business Profile Reference
| Profile | Typical FCF Margin | CapEx Intensity | Conversion Clue | Interpretation Note |
|---|---|---|---|---|
| Asset-light services or software | 15% to 35% | 1% to 6% | Often above 90% | Working capital timing can move quarterly FCF sharply. |
| Retail or distribution | 2% to 8% | 2% to 7% | Inventory cycles matter | Seasonal working capital can distort short periods. |
| Manufacturing or industrial | 4% to 12% | 4% to 12% | Depreciation gap matters | Expansion programs can depress FCF despite earnings. |
| Telecom, utility, or infrastructure | 0% to 10% | 12% to 30% | Stable but capital heavy | Maintenance versus growth CapEx split is critical. |
| Early growth or startup | -40% to 5% | Varies widely | Burn rate matters | Negative FCF can be planned if runway is sufficient. |
| Cyclical or commodity-linked | -10% to 20% | 5% to 18% | Cycle timing matters | Use multi-year averages rather than one peak year. |
| Turnaround or restructuring | -15% to 10% | Reduced or delayed | One-time cash items | Separate sustainable FCF from temporary releases. |
🧭Preset Scenario Reference
| Scenario | OCF | CapEx | Revenue | Net Income | FCF | Margin | Read |
|---|---|---|---|---|---|---|---|
| Mature SaaS | $12.5M | $3.4M | $48.0M | $7.8M | $9.1M | 19.0% | Healthy recurring cash generation |
| Retail Chain | $34.0M | $21.0M | $620.0M | $18.0M | $13.0M | 2.1% | Thin but positive cash margin |
| Factory Expansion | $88.0M | $105.0M | $740.0M | $62.0M | -$17.0M | -2.3% | Expansion CapEx exceeds operating cash |
| Utility CapEx Cycle | $410.0M | $365.0M | $2.4B | $230.0M | $45.0M | 1.9% | High capital intensity profile |
| Startup Burn | -$7.2M | $1.1M | $18.0M | -$12.5M | -$8.3M | -46.1% | Negative FCF and runway focus |
| Asset-Light Software | $96.0M | $8.0M | $310.0M | $72.0M | $88.0M | 28.4% | High conversion, low CapEx drag |
| Consumer Brand | $58.0M | $18.0M | $415.0M | $41.0M | $40.0M | 9.6% | Solid cash conversion |
| Turnaround Year | $22.0M | $4.0M | $260.0M | -$15.0M | $18.0M | 6.9% | Positive FCF despite net loss |
| Acquirer Screen | $215.0M | $52.0M | $1.1B | $140.0M | $163.0M | 14.8% | Strong debt capacity screen |
⚖Free Cash Flow Signal Table
| Metric | Strong Signal | Neutral Signal | Risk Signal | Best Paired Check |
|---|---|---|---|---|
| FCF margin | Above peer band | Near peer band | Negative or shrinking | Revenue quality and CapEx cycle |
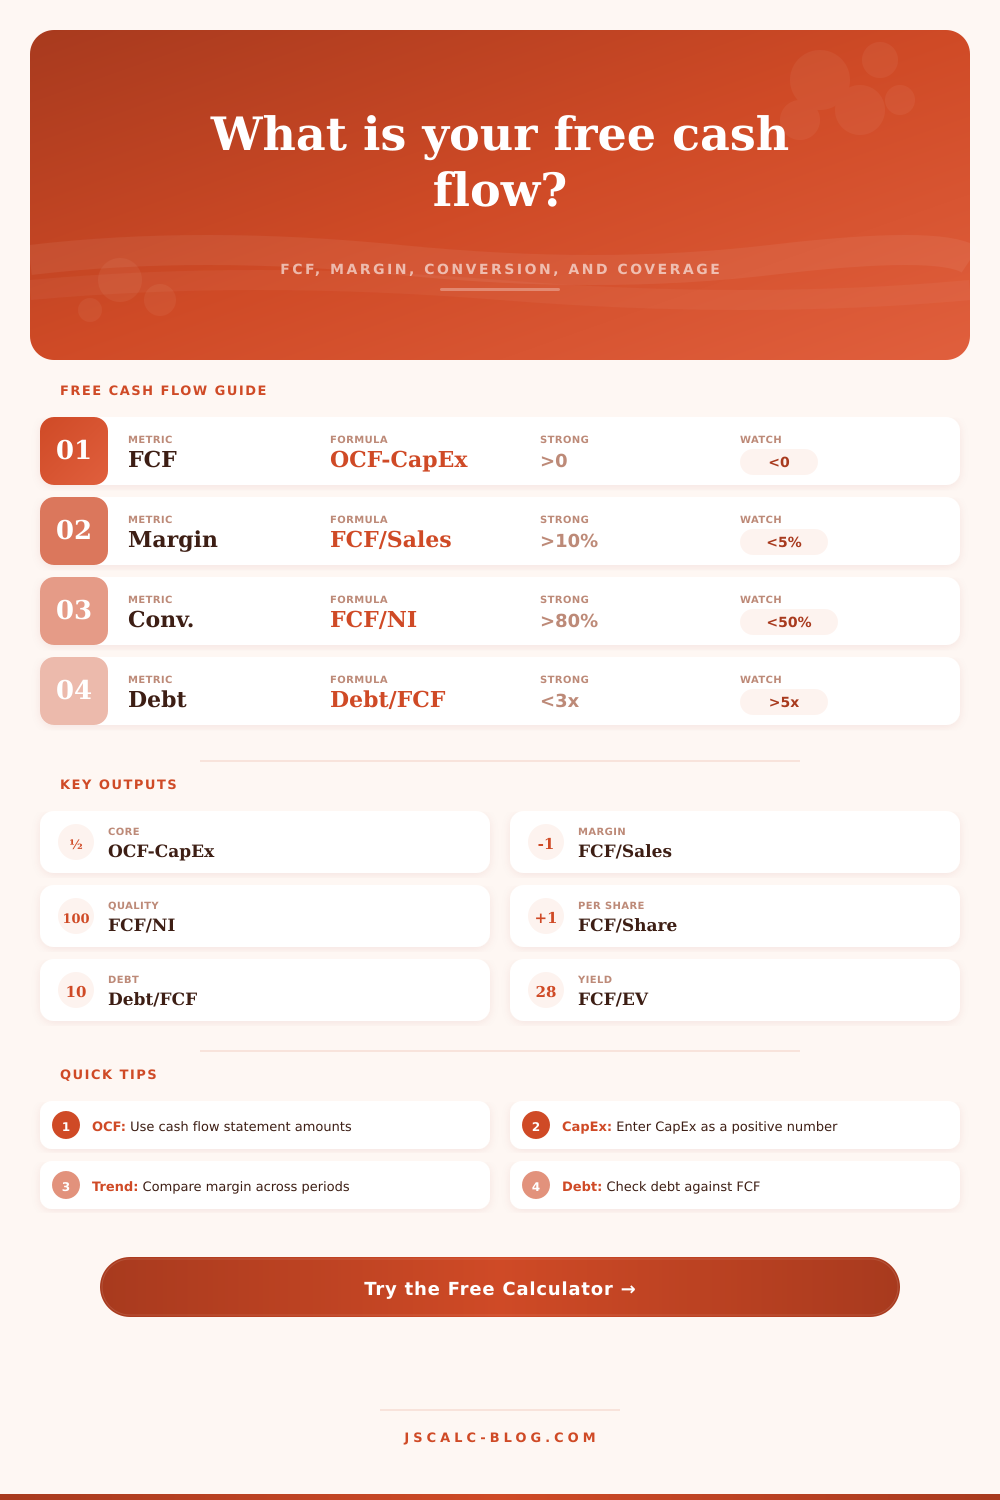
| Cash conversion | 80% to 120% | 50% to 80% | Below 50% for repeated periods | Receivables, inventory, and accruals |
| CapEx intensity | Stable and planned | Temporarily elevated | High with weak growth | Maintenance versus growth split |
| Net debt / FCF | Below 3.0x | 3.0x to 5.0x | Above 5.0x or negative FCF | Interest coverage and maturities |
| FCF per share | Rising over time | Flat with stable share count | Falling while revenue grows | Dilution and buyback timing |
| FCF yield | High versus peers | Near peer group | Low despite slow growth | Balance sheet and growth durability |
🔍Common Cash Flow Statement Lines
| Line Item | Use In Calculator | Sign Convention | Common Issue | Practical Treatment |
|---|---|---|---|---|
| Net cash from operating activities | Operating cash flow input | Positive if inflow | One-time tax or settlement cash | Review notes for unusual items |
| Purchase of property and equipment | Capital expenditures input | Enter as positive outflow | Statement may show a negative number | Use absolute amount for CapEx field |
| Capitalized software development | May belong in CapEx | Usually investing outflow | Can be excluded by casual screens | Include if it sustains operations |
| Proceeds from asset sales | Usually exclude from core FCF | Positive inflow | Can inflate reported investing cash | Treat separately from recurring FCF |
| Cash interest paid | Unlevered adjustment input | Positive cash paid | Location varies by reporting standard | Use the cash flow note if available |
| Dividends paid | Not subtracted from basic FCF | Financing outflow | Often confused with CapEx | Compare after FCF is calculated |
💡Free Cash Flow Tips
The income statement tell you what the company says it’s earning; the balance sheet tell you where that money is sitting. Neither one, though, tells you if this business has a hope in hell of paying its bills next month. That’s the difference between paper profits and liquidity. That’s why free cash flow is still by far the most honest number in all of corporate finance. It removes all the scheduling for depreciation and other accounting adjustments and shows how much real cash the business generate, after lights are kept on and machines are made to hum.
How do you get there? Start with operating cash flow, which is money the business gets in from doing its core business activities. Then subtract capital expenditures, which is the money the business spend on upgrading or maintaining its physical assets. Once you’ve plugged both of those main figures into the calculator above, it’ll do the rest of the math for you … but knowing what each of those numbers represent in the real world is just as important than the final number itself.
Why Free Cash Flow Is the Most Honest Number
Cash flow: Earnings can be manipulated via aggressive depreciation schedules, inventory write-downs, or timing differences (e.g., putting expenses into current quarters instead of later ones). Net income appear cleaner on a spreadsheet, which is why most investors over-focus on it. Cash flow is difficult to fake, and if there is no cash, the company will not be able to service debt, buy back shares, or pay dividends. Understanding what’s really being measured is the key here.
What you’re looking at when you enter your operating cash flow is net cash provided by operations from the cash flow statement. It shows the operational reality of the business cycle and already includes changes in working capital such as buildup of inventory or lagging collection of accounts receivable.
The part that requires some care, and should be entered as a positive number, meaning a cash outflow is a positive number, is the capital expenditure. A common failing in many analysis models are that they don’t distinguish between growth capital expenditures and maintenance capital expenditures. Growth capital expenditures are those that build capacity for the future; maintenance capital expenditures are those needed to keep existing revenue engine humming along.
This calculator breaks these down with an input called maintenance share so you can understand how much is actualy discretionary cash once the business is maintained. For example, you could have a manufacturing plant with very high overall capex, but if a large portion is maintenance, then underlying cash generation may well be pretty strong. That shifts the interpretation of what the final number for free cash flow mean.
That number in isolation doesn’t mean much; it needs some context, which is where the output metrics come into play. Free cash flow margin indicates an efficiency with which revenue becomes actual cash (a very important metric in a capital intensive industry like utilities vs. An asset light software business). Cash conversion ratio measure free cash flow against net income. A ratio north of 100% means the company is producing cash exceeding its reported profits; this is a sign of good quality. Low ratios can signal deterioration in working capital or aggressive accrual practices, meaning earnings are fragile instead of durable. These is lasting earnings.
From there, consider the other side: debt coverage and yield metrics. How many years will it take to pay down debt at current rate of cash generation? That’s a very simple way to think about this, but it gives you a quick sanity check on financial leverage. If that number is too high, then business doesn’t have much margin for error. Another one is enterprise value yield, which is free cash flow as a percentage of the entire value of the firm. This give you an idea of return at your given price. These output fields will work together to paint a full picture of financial health.
Another common mistake is failing to consider the time horizon. Trailing twelve-month measures tend to smooth out any bumps caused by one-time tax payments or seasonal inventory purchases, so analysts frequently examine this measure.
The second mistake is assuming that all free cash flow can be paid out as dividends because it is “free.” In fact, businesses must reinvest some free cash flow to stay ahead of competitors and grow. The aim isn’t to eke out as much free cash flow as possible while sacrificing potential growth; instead, the search is for sustainable balance.
To help you avoid comparing a software startup to a utility company, this page includes a reference table. Every industry has its own typical amount of capital needed and its own pace. The table shows typical benchmarks for various industries.
Free cash flow is an options game. When you see a company with healthy free cash flow, it means they have been able to return cash back to shareholders, continue funding innovation, and survive during economic downturns. On the flip side, when you see a company with poor free cash flow, you know they’re always in catch-up mode and constantly needing to raise money. Your judgement drives the investment idea, while the numbers give you the proof. You want to invest in a reliable business, not just one that makes money on paper. That’s how you build long term value.
The income statement says it earned X; the balance sheet says it has Y sitting on its books. But free cash flow shows what it realy retained.