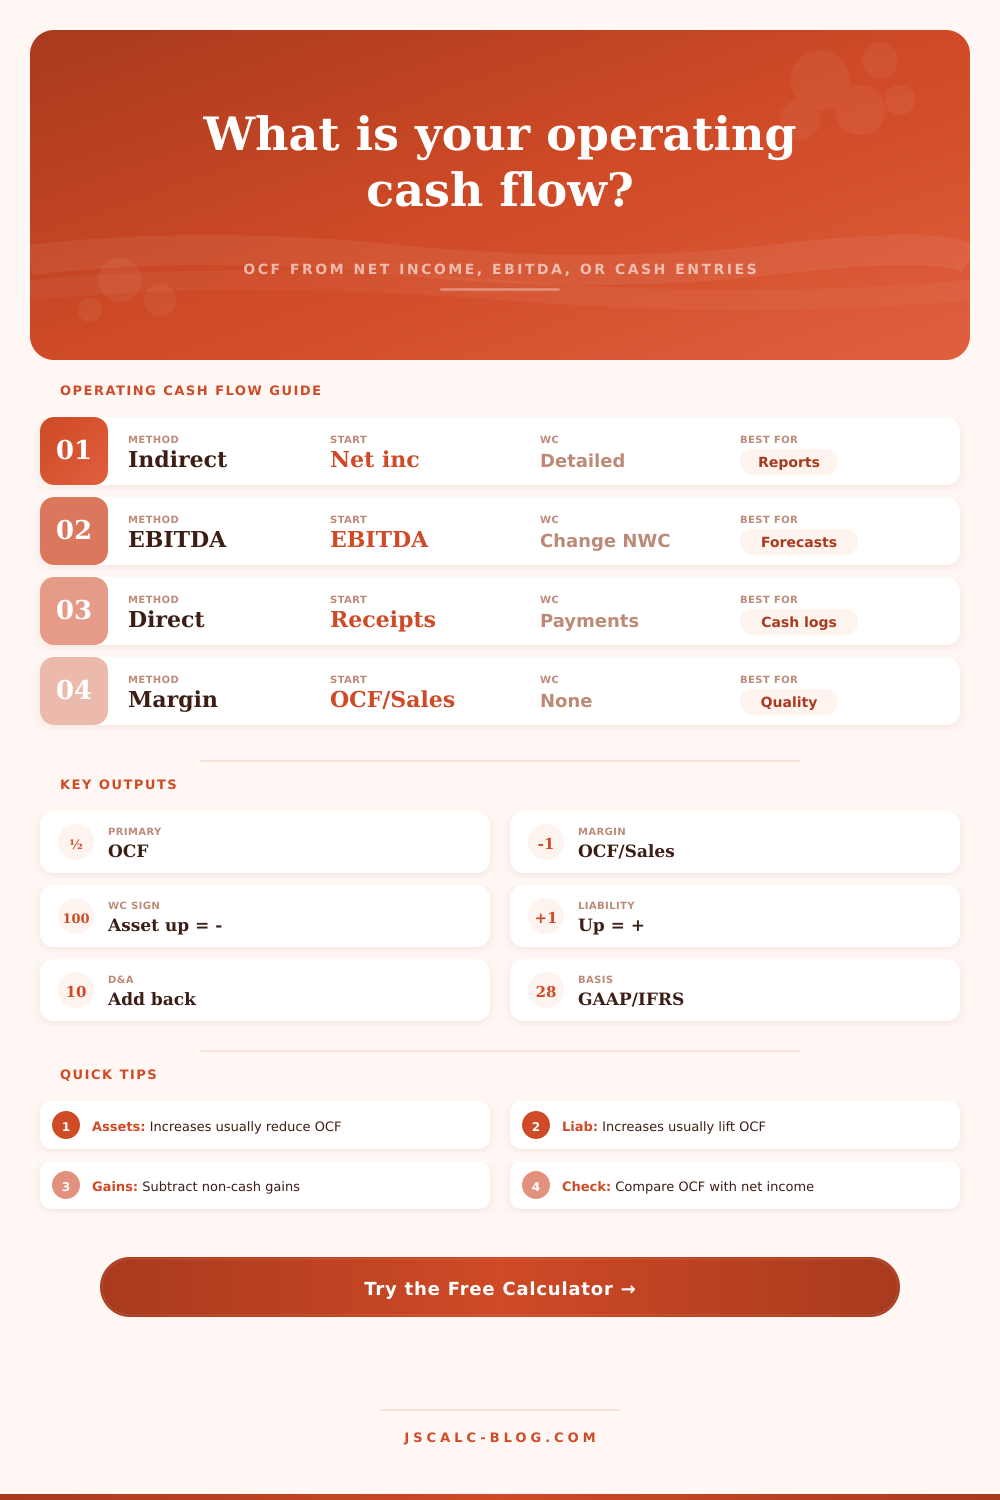
Operating Cash Flow Calculator
Estimate cash flow from operations with an indirect statement bridge, EBITDA-to-cash bridge, or direct cash receipts and payments. The calculator separates non-cash addbacks, working capital movement, tax, interest classification, cash margin, and cash conversion.
🎯Operating Cash Flow Presets
🧮Calculation Method
Pick the starting data you have. Each method produces the same OCF concept from different inputs.
Used for annualized OCF display and period wording.
This changes labels only; enter all amounts in the same currency.
US GAAP normally treats interest paid as operating; some IFRS presentations classify it as financing.
Used for operating cash flow margin and annualized run-rate checks.
Result cards compare OCF margin with this chosen operating target.
📘Indirect Method Inputs
Start with accrual net income after tax.
Non-cash D&A is added back to net income.
Enter non-cash compensation expense for the period.
Impairments, provisions, unrealized losses, or similar non-cash charges.
Positive for deferred tax expense; negative for deferred tax benefit.
Enter gains as negative addbacks and losses as positive addbacks.
📈EBITDA Bridge Inputs
Earnings before interest, taxes, depreciation, and amortization.
Subtract taxes actually paid during the period.
Subtracted only when interest is classified as operating.
Use positive for cash inflows and negative for operating cash drains.
💵Direct Cash Inputs
Cash receipts from sales, subscriptions, services, or patient collections.
Include refunds, deposits retained, rebates, or other operating receipts.
Inventory, materials, vendor invoices, and contractor operating payments.
Wages, benefits, payroll taxes, and bonuses paid in cash.
Rent, utilities, marketing, software, insurance, and routine operating spend.
Subtract taxes paid through operating cash accounts.
Included or excluded according to the interest classification selector.
🔄Working Capital Changes
Ending AR minus beginning AR. Increase reduces operating cash flow.
Ending inventory minus beginning inventory. Increase uses cash.
Increase in prepaid expenses usually reduces OCF.
Ending AP minus beginning AP. Increase usually boosts OCF.
Increase in accrued liabilities adds to operating cash flow.
Increase in customer deposits or unearned revenue adds cash.
📌Current Cash Flow Snapshot
📐Formula Breakdown
🧭Working Capital Sign Reference
| Line Item | Positive Change Means | OCF Direction | Calculator Treatment | Common Reason |
|---|---|---|---|---|
| Accounts receivable | Customers owe more | Lower OCF | Subtract increase | Revenue booked before cash collection |
| Inventory | More stock on hand | Lower OCF | Subtract increase | Purchases made before product is sold |
| Prepaids and other assets | Cash paid ahead | Lower OCF | Subtract increase | Insurance, rent, software, deposits |
| Accounts payable | Vendors unpaid longer | Higher OCF | Add increase | Vendor timing or purchasing terms |
| Accrued expenses | Expenses not yet paid | Higher OCF | Add increase | Payroll, bonuses, taxes, utilities |
| Deferred revenue | Cash received before revenue | Higher OCF | Add increase | Subscriptions, deposits, retainers |
📊Operating Cash Flow Scenario Table
| Scenario | Method | Revenue | Starting Metric | Asset Change | Liability Change | Typical OCF Read |
|---|---|---|---|---|---|---|
| SaaS annual renewal | Indirect | $1.25m | Net income $180k | Moderate AR rise | Deferred revenue lift | Cash flow above earnings |
| Retail inventory build | Indirect | $920k | Net income $96k | Large inventory increase | AP increase partly offsets | Profit exceeds cash |
| Manufacturer receivables lag | EBITDA | $2.40m | EBITDA $340k | AR and inventory use cash | Accruals modest | Cash drag from growth |
| Consulting collection push | Indirect | $640k | Net income $118k | AR decreases | Low deferred revenue | OCF margin expands |
| Restaurant weekly cash | Direct | $72k | Receipts $70k | Not used directly | Not used directly | Fast cash cycle |
| Ecommerce holiday spike | EBITDA | $1.85m | EBITDA $260k | Inventory build before sales | AP and accruals support cash | Timing-sensitive OCF |
| Clinic insurance receipts | Direct | $310k | Receipts $268k | Not used directly | Not used directly | Collection lag visible |
| Deferred revenue lift | Indirect | $780k | Net income $74k | Small prepaid increase | Large deposits received | Strong cash conversion |
| Milestone billing project | EBITDA | $1.10m | EBITDA $165k | AR rises after milestone | Payables fall after mobilization | Cash trails earnings |
⚖Method Selection Reference
| Method | Best Input Source | Strength | Main Caution | Use When |
|---|---|---|---|---|
| Indirect from net income | Income statement and balance sheet | Matches common financial statement presentation | Needs correct sign on each balance sheet change | You have accrual statements |
| EBITDA bridge | Management reporting or forecast model | Fast bridge from earnings to cash | Can miss unusual cash items if omitted | You model cash conversion |
| Direct cash receipts | Bank activity or cash ledger | Shows real receipts and payments clearly | Needs careful classification of operating cash only | You track cash directly |
| OCF margin | OCF and same-period revenue | Normalizes cash flow across periods | Seasonal working capital can swing the ratio | You compare periods or units |
| Cash conversion ratio | OCF and earnings start point | Highlights accrual-to-cash quality | Weak when earnings are near zero | You test earnings quality |
🔍Cash Flow Quality Checks
| Check | Healthy Pattern | Watch Pattern | Why It Matters | Calculator Clue |
|---|---|---|---|---|
| Receivables | AR grows slower than revenue | AR jump absorbs profit | Sales may not be collected yet | Large negative asset impact |
| Inventory | Inventory turns with sales | Inventory build drains cash | Stock ties up cash before sale | Inventory change is positive |
| Payables | AP increase aligns with purchasing | AP rise masks weak collections | Delayed payments can temporarily boost OCF | Liability impact drives OCF |
| Deferred revenue | Cash collected before service | Future service obligation grows fast | Cash is strong but work remains | Deferred revenue adds OCF |
| Non-cash addbacks | D&A and SBC explain earnings gap | Large unusual addbacks dominate | Quality depends on repeatability | Addbacks exceed net income |
| Cash taxes and interest | Classified consistently each period | Classification changes year to year | Comparability can break | Basis selector changes OCF |
💡Operating Cash Flow Tips
The problem is running out of cash, even if you’re profitable on paper. Operating cash flow is a superior measure then net income when someone is writing checks. Net income is an accountant’s opinion, an estimate, an accrual. Cash flow is real life.
Whether you track receipts directly or adjust an indirect statement, the tool above allow you to bridge that gap… Turning your earnings into a tangible form of cash.
Why Cash Flow Is More Important Than Net Income
For most people, they begins with the indirect method, since this reflects financial statements that they’re familiar with. Simply taking their net income and subtracting out non-cash items. Classic: depreciation and amortization. These lower their taxable income, but don’t actualy hit your bank account. Add these amounts back in. Same goes for stock-based compensation.
The tricky part is knowing the sign of change to working capital. When accounts receivable go up, that’s a good thing (growth!), right? Wrong! It’s an increase in assets that hasn’t been collected yet. This asset increase will drag on your cash position, as cash is trapped in invoices.
Liabilities help with cash timing. When your accounts payable rise, it imply you’re keeping more cash in-hand before making payments to vendor. This postpones an outflow. The calculator automatically take care of flipping directional signs for you, there’s no need to memorize which side of the balance sheet adds and which side subtracts. Simply recognize that assets use up cash while liabilities keep it.
The EBITDA bridge may feel more natural if you’re predicting, instead of reporting. Because it skips over all those non-cash charges and tax provision complexities at the beginning of income statement, starting further up is easier. So you take out interest that you actually wired and the cash taxes that you actually paid. That’s quicker, but you have to be disciplined in defining “operating.”
Do you count interest as financing? Some do, because then they can boost their operating cash flow number. Others simply adhere to GAAP rules and put it in. Depending on your answer, your margin swing by a big amount. It isn’t semantics. It impacts how lenders see whether you’ll be able to pay your debt solely with operating earnings.
For the purists: The direct method. Every receipt from customers and every payment to suppliers and payroll gets listed. It’s granular and honest; it doesn’t allow you to hide behind your ledger, but to face up to your bank statements. While tedious for most small business, it offers cleanest view of cash burn. If your bookkeeping supports it, the tool lets you mimic this level of detail with its direct inputs.
Beyond the raw number, keep an eye on operating cash flow margin. In other words, it is your cash divided by your revenue. Is your core business generating real liquidity? You want to see a healthy margin. If your profits increase but your margin shrinks, that’s a warning sign. More likely than not it means you’re stuffing inventory in your warehouse or extending credit too freely to fuel sales. That growth is fragile and expensive.
The page’s reference tables lays out how various industries handle those swings. A retailer bulking up inventory for the holidays will look very different from a software company carrying deferred revenue. And both can be healthy. Context is everything.
Perform another sanity check by considering the cash conversion ratio. Have you been able to convert your accounting profits into actual cash? Is the operating cash flow larger (or smaller) than initial earnings metric? Something is sucking up the money if it’s smaller. Maybe it’s a build-up of prepaid expenses or a delay on collections. Check the details of working capital adjustments and go after that gap.
Only one metric can’t be massaged with creative accounting: cash is king. You can argue over reserve provisions or depreciation methods. You could of argued about the number in your operating account.
Stress-test your assumptions with the calculator. Run it through scenarios of a two-week delay in paying suppliers or a five percent drop in collections. How does that affect your runway? The more you see the mechanism driving the motion, the less you guess and the more you manage. That’s what clarity looks like when a confusing spreadsheet becomes a trusted compass for your business.