Net Present Value Calculator
Estimate project NPV from an upfront investment, yearly cash flow pattern, discount rate, risk premium, timing convention, terminal value, and working-capital recovery. The calculator also reports IRR, profitability index, equivalent annual annuity, and discounted payback.
🎯NPV Scenario Presets
🧮Project Cash Flow Inputs
Adds a profile risk premium to the base discount rate.
The selected pattern shapes yearly operating cash flow.
Year 0 cash outflow before any operating benefits.
Net annual cash flow after operating expenses and taxes.
Used directly for growing or declining patterns.
Whole project years, from 1 to 30.
Use the opportunity cost before profile risk premium.
Terminal value is still discounted at the end of final year.
Resale, residual, or final-year exit value.
Recovered as a final-year cash inflow based on initial investment.
🔢Current Value Snapshot
📅Discounted Cash Flow Schedule
| Year | Operating Cash Flow | Terminal/Recovery | Total Cash Flow | Discount Factor | Present Value | Cumulative PV |
|---|---|---|---|---|---|---|
| 1 | $62,000 | $0 | $62,000 | 0.9174 | $56,879 | -$193,121 |
📋Project Risk Premium Reference
📚NPV Decision Thresholds
| Metric | Formula | Accept Signal | Borderline Signal | Watch Item |
|---|---|---|---|---|
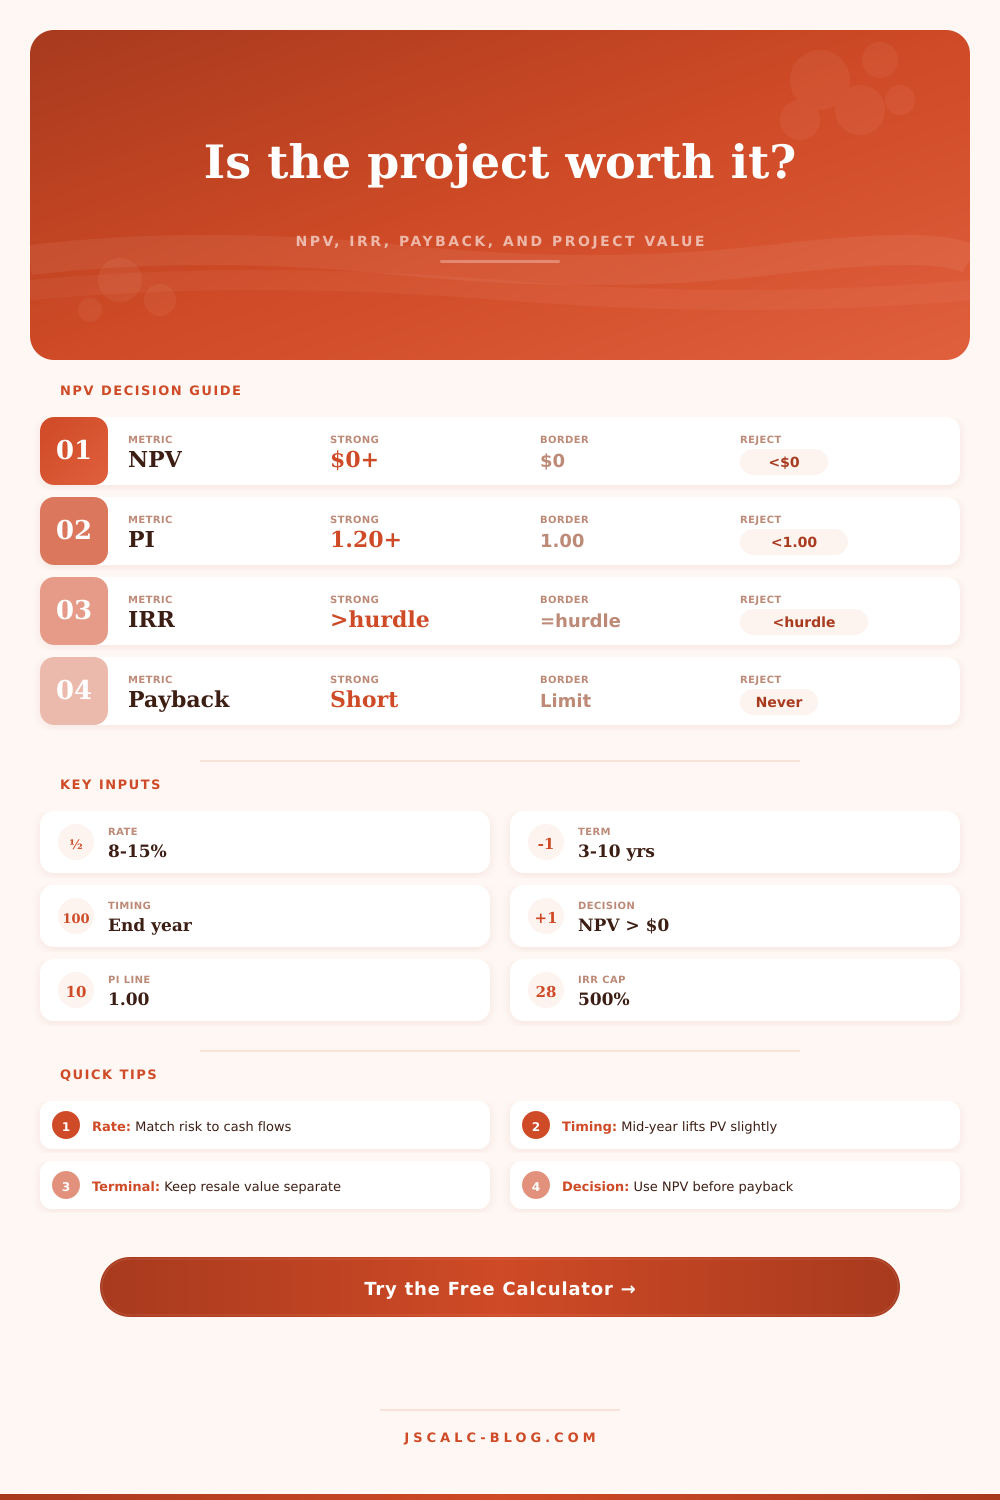
| Net present value | PV inflows - initial investment | Above $0 | Near $0 | Most direct value test |
| Profitability index | PV inflows / initial investment | Above 1.00 | 0.95 to 1.05 | Useful when capital is limited |
| Internal rate of return | Rate where NPV = 0 | Above hurdle rate | Near hurdle rate | Can mislead with unusual flows |
| Discounted payback | Cumulative discounted inflows | Before project limit | Near final year | Ignores value after recovery point |
| Equivalent annual annuity | NPV spread over project life | Positive annual value | Near $0 per year | Good for unequal project lives |
| Simple ROI | Net undiscounted gain / investment | Positive backup signal | Small gain | Does not include time value |
📈Preset Scenario Benchmarks
| Scenario | Initial Investment | Year 1 Flow | Pattern | Base Rate | Years | Terminal Value | Typical Use |
|---|---|---|---|---|---|---|---|
| Equipment replacement | $250,000 | $62,000 | Level | 8.0% | 6 | $50,000 | Replace older machinery |
| SaaS feature build | $420,000 | $95,000 | Growth | 10.0% | 7 | $0 | Subscription expansion |
| Solar retrofit | $180,000 | $30,000 | Level | 6.5% | 10 | $18,000 | Energy savings stream |
| Warehouse expansion | $1,200,000 | $205,000 | Ramp-up | 9.0% | 10 | $650,000 | Capacity and property value |
| New product launch | $850,000 | $140,000 | Ramp-up | 11.5% | 8 | $75,000 | Growth with launch risk |
| Fleet upgrade | $560,000 | $118,000 | Declining | 8.5% | 7 | $95,000 | Efficiency benefits fade |
| Clinic equipment | $310,000 | $72,000 | Growth | 7.5% | 6 | $40,000 | Procedure throughput |
| Small acquisition | $2,400,000 | $420,000 | Terminal-heavy | 12.0% | 8 | $1,500,000 | Cash flow plus exit value |
| Subscription rollout | $650,000 | $105,000 | Growth | 10.5% | 9 | $0 | Recurring revenue build |
⚖Discount Rate and Timing Reference
| Setting | Calculator Treatment | When It Fits | Effect On NPV | Main Caution |
|---|---|---|---|---|
| End-year timing | Cash flow discounted by year t | Standard annual DCF model | Baseline result | Can understate smooth monthly inflows |
| Mid-year timing | Operating flow discounted by t - 0.5 | Cash arrives evenly through year | Raises operating PV | Terminal value stays at final year |
| Beginning timing | Operating flow discounted by t - 1 | Benefits start early in each year | Highest operating PV | Use only when timing supports it |
| Profile premium | Added to base rate | Project has above-base risk | Lowers NPV as premium rises | A rough screen, not a full WACC model |
| Terminal value | Discounted at final year | Resale, exit, or residual value | Can be a major NPV driver | Do not hide weak operations inside exit value |
| Working capital recovery | Initial investment percent in final year | Inventory or deposit released later | Adds final-year PV | Only include recoverable amounts |
📐Formula Method
🔍NPV Model Quality Checks
| Check | Good Sign | Risk Sign | Why It Matters | Calculator Field |
|---|---|---|---|---|
| Cash flow basis | Uses incremental net cash flow | Uses accounting profit only | NPV needs cash, not book earnings | Year 1 net cash flow |
| Rate matching | Nominal cash flows use nominal rate | Real and nominal mixed | Mismatch distorts present value | Base discount rate |
| Terminal dependence | Operations support most value | Exit value drives the whole case | Terminal estimates are often uncertain | Terminal value |
| Project life | Life matches asset or contract term | Benefits extended too long | Extra years can inflate NPV | Analysis period |
| Recovery assumption | Only recoverable capital included | All sunk costs recovered | Recovery affects final-year value | Working capital recovery |
| Pattern realism | Ramp or fade matches adoption | Flat flow hides volatility | Timing changes discounted value | Cash flow pattern |
💡Practical NPV Tips
A half-a-million-dollar machine sits before you. Sales rep’s raving about lower downtime and higher efficiency. But something in your gut’s bellowing out “danger!”
That’s when we need to combine cold arithmetic with financial instinct. That’s what net present value does, it takes future promises and translates them into today’s purchasing power. In other words, it helps you answer one simple question: Do I make more (or lose less) money from this investment down the road then I’m spending up-front after accounting for the fact that a dollar today is worth more than a dollar tomorrow?
What Is Net Present Value?
The net present value calculator above will do all that hard work on the conversion process by taking your estimated cash flows and discounting them back to today so you can compare apples to apples. That’s the heart of the logic, which is simple yet hard to grasp. You’re not blindly totalling future dollars. You’re applying a risk adjustment and a time adjustment.
What would you do with that money instead? Would you invest it in the bank? Then you’ll earn interest. Would you invest it in something like a volatile stock, whose higher returns makes up for its risk? That discount rate is your expected return on those future cash flows. The higher your chosen rate, the lower those future cash flows is worth in today’s currency. The table on page suggests risk premiums for various types of project so that you don’t make the mistake of assuming a safe rate when investing in something speculative. It makes you think about how much of a crapshoot that revenue stream is.
“Time has more impact than most people think about.” A dollar earned at the start of the year is worth way more then one earned at the end. By choosing beginning-of-year, mid-year, and end-year conventions, the tool accounts for this timing. If you’re running an operating business, then mid-year is frequently the sweet spot; revenue doesn’t all hit your account on the thirty-first day of December; instead, it trickles in over the course of the year. That slight modification can move net present value just enough to tip a marginal decision. It’s not a big difference but it’s rooted in reality.
Terminal value” refers to what the asset is valued as once the analysis period ends. Whether it’s exiting a lease or selling off old equipment, you should of account for that last payout… otherwise, you’ll underestimate the overall return.
So don’t just focus on the headline number; dig into the supporting metrics. Does it deliver an internal rate of return that exceeds your cost of capital? Then you are generating value. How much value do you create per dollar spent? This is what the profitability index measures, helpful if you have constrained cash and multiple opportunities from which to choose. Think about these three in combination. NPV measures the size of the value created, while the IRR and the index allows you to sort through alternatives and pick the best.
But remember: don’t let yourself get bogged down by the exactness of the decimals. A financial model is only as accurate as the assumptions that feed into it. No matter how mathematically rigorous you may be, if your revenue prediction is an optimistic guess, then output won’t be reliable. Stress test your inputs. Then run the numbers again using a lower growth rate (or a higher discount rate).
If the deal holds up when tested, congratulations, you’ve got yourself a solid investment. If it barely makes a profit, then you’re going to have to walk away or renegotiate. Running the numbers isn’t the end goal; understanding what they tell us about the underlying business case is. That’s what turns a spreadsheet into a strategic advantage.