Payback Period Calculator
Estimate how many months an investment needs to recover its upfront outlay. This calculator models simple payback, discounted payback, ramp-up, operating expense, residual value, horizon ROI, and the monthly net cash flow needed for a target recovery date.
🎯Payback Scenario Presets
🧮Investment Inputs
Category supplies a typical life and risk reserve reference.
Reserve inflates initial outlay for implementation slippage.
Include equipment, setup, installation, and launch work.
Subtracted before the reserve adjustment.
Extra contribution, savings, avoided spend, or capacity value.
Maintenance, subscriptions, supplies, energy, or support.
Use a negative value if benefit declines over time.
Cash flow scales linearly from month one to full run rate.
Used for discounted payback and present-value cash flows.
Estimated resale, salvage, or remaining asset value.
Calculator totals monthly cash flow through this horizon.
Used to estimate the monthly net flow required to hit target.
📊Current Payback Snapshot
💼Project Category Reference
| Category | Typical Life | Reserve | Common Cash Flow | Watch Point |
|---|---|---|---|---|
| Equipment or machine | 48 to 84 months | 10% | Capacity gain or labor saved | Downtime and maintenance |
| Software automation | 24 to 60 months | 8% | Hours saved or errors avoided | Adoption and integration |
| Energy efficiency upgrade | 60 to 180 months | 6% | Utility savings | Seasonality and rate changes |
| Training or enablement | 12 to 36 months | 12% | Productivity or close-rate lift | Decay without reinforcement |
| Campaign or funnel asset | 6 to 24 months | 15% | Incremental margin | Attribution and fatigue |
| Facility improvement | 60 to 120 months | 14% | Rent saved or throughput gain | Permits and disruption |
| Product launch asset | 18 to 48 months | 18% | Contribution margin | Ramp and demand risk |
| Delivery or service vehicle | 36 to 72 months | 11% | Route capacity or avoided rentals | Repairs and utilization |
📈Preset Comparison Table
| Preset | Outlay | Net Month 1 | Ramp | Growth | Horizon | Discount | Reason To Model |
|---|---|---|---|---|---|---|---|
| Solar retrofit | $28,000 | $460 | 2 mo | 1.5% | 120 mo | 6% | Slow asset with long life |
| SaaS automation | $18,000 | $1,220 | 3 mo | 2.0% | 60 mo | 8% | Labor savings after setup |
| Cafe equipment | $9,500 | $790 | 1 mo | 0.0% | 36 mo | 9% | High-use operational machine |
| Warehouse LED | $42,000 | $1,850 | 0 mo | 2.5% | 96 mo | 7% | Utility and maintenance reduction |
| Sales training | $14,000 | $1,500 | 4 mo | -6.0% | 24 mo | 10% | Benefit decays without refreshers |
| Heat pump upgrade | $22,500 | $360 | 1 mo | 3.0% | 120 mo | 5% | Long life and seasonal savings |
| CNC fixture | $31,000 | $2,900 | 2 mo | 1.0% | 48 mo | 11% | Faster throughput per batch |
| Course launch | $12,000 | $2,150 | 2 mo | -12.0% | 18 mo | 12% | Front-loaded launch cash flow |
| Delivery e-bike | $5,800 | $490 | 0 mo | 0.5% | 36 mo | 8% | Avoided mileage and rentals |
🧭Payback Decision Bands
| Simple Payback | Typical Reading | Discount Check | Best Use | Next Step |
|---|---|---|---|---|
| 0 to 6 months | Immediate recovery | Usually still fast | Low-risk operational fixes | Verify cash-flow source |
| 7 to 18 months | Fast payback | PV gap usually modest | Productivity and capacity projects | Check implementation risk |
| 19 to 36 months | Normal business case | Discounting matters | Equipment and software cases | Compare to asset life |
| 37 to 60 months | Slow recovery | PV may be weak | Long-lived energy or facility assets | Stress-test assumptions |
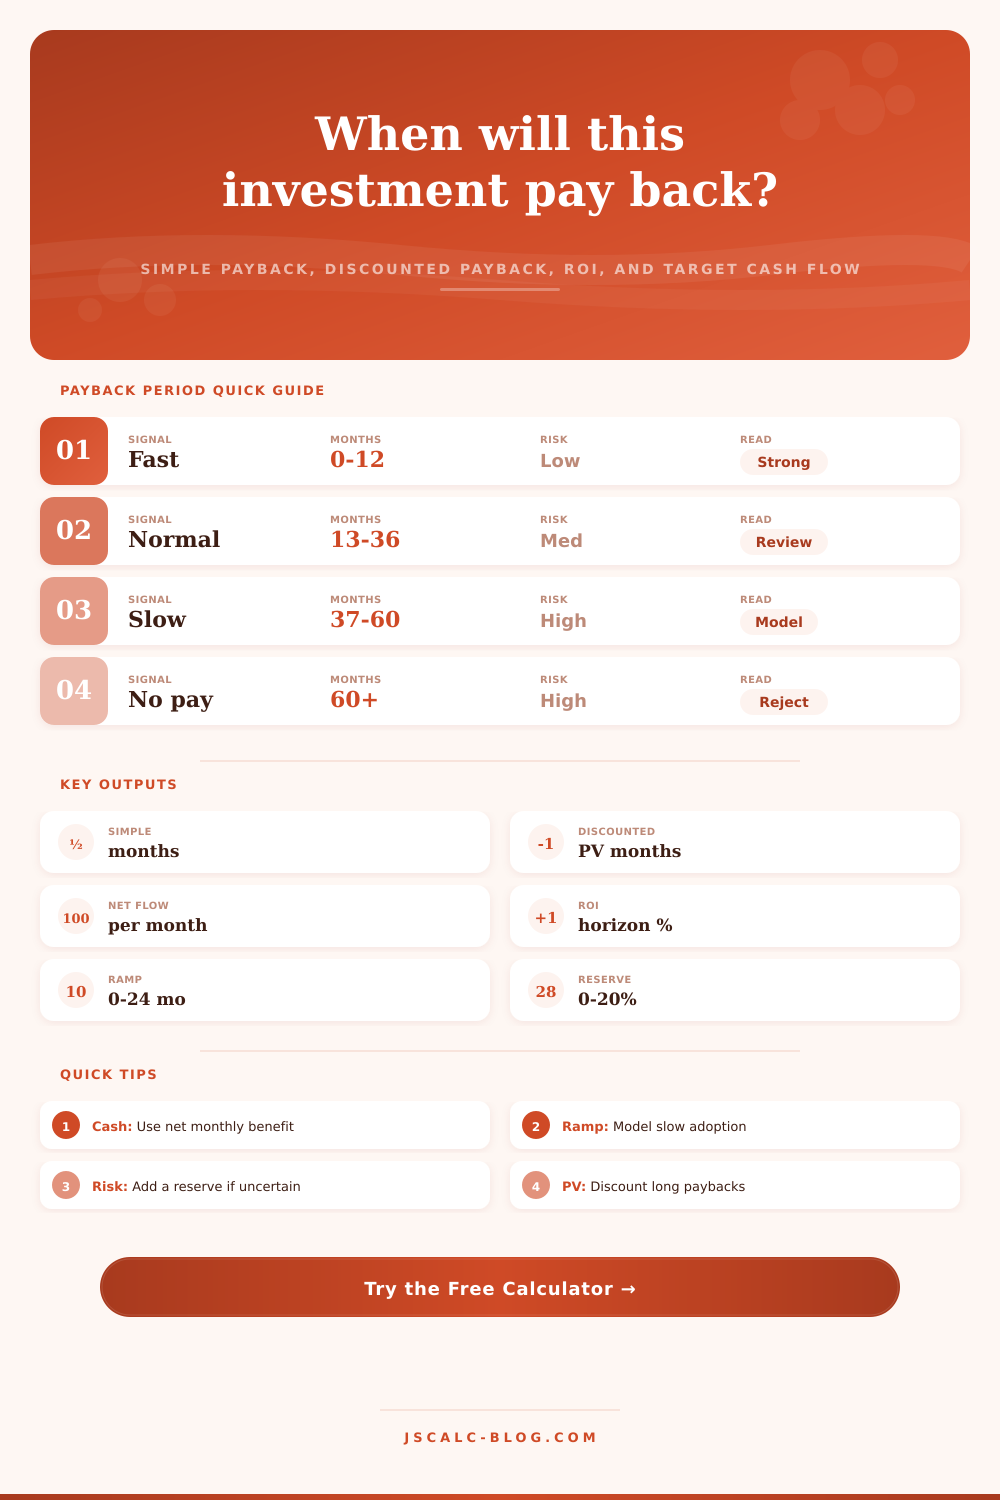
| Over 60 months | Strategic only | Often no discounted payback | Mandatory or noncash value projects | Use NPV and risk review |
| No payback | Cash never recovers | PV remains negative | Compliance or mission cases only | Revise scope or benefits |
⚖Formula and Method Notes
🔍Cash Flow Quality Checks
| Check | Good Sign | Risk Sign | Why It Matters | Adjustment |
|---|---|---|---|---|
| Net flow basis | Uses contribution or savings after expense | Gross revenue only | Payback is a cash recovery measure | Subtract operating expense |
| Ramp timing | Benefit starts gradually when adoption is needed | Full benefit on day one | Early months drive payback speed | Add 1 to 6 ramp months |
| Discount rate | Matches hurdle rate or borrowing cost | Zero rate for long projects | Long-dated cash is worth less today | Review discounted payback |
| Residual value | Based on resale or remaining useful value | Used to force break-even | Residual may not be liquid | Cap or exclude it |
| Useful life | Payback occurs before likely replacement | Payback after asset life | Late recovery may never arrive | Compare to category life |
| Volatility | Benefit is measurable and repeatable | One-time launch spike | Forecast can decay quickly | Use negative growth or reserve |
💡Practical Payback Tips
There’s something about buying a new machine that makes you optimistic. It has a gleaming piece of metal in front of you, and it says on the brochure that this will make things more efficient. In your mind, it mean better profits for your bottom line.
Usually, the movie version doesn’t turn out like that. Installation never happens as fast as they said it would. There are hidden expenses around maintaining it. Things don’t save right away. Most business plans stall here, the gap between the promise and the payoff.
How to Calculate When Your Money Comes Back
The investment itself isn’t always terrible. It’s just that nobody bothered to check when the money actualy comes back.
There’s no more straightforward metric in the world of finance than “payback,” but it’s also the most misunderstood. It simplifies all the accounting mumbo jumbo around tax shields and depreciation into one simple question: How many months will it take before the cash flowing out of my pocket equals the cash flowing back in? That’s the only question you need to ask about the cash-flow side of business.
Yes, perhaps your project has an amazing long-term return on investment. But if it sucks up your operating capital for 30 months, you may not make it long enough to earn anything.
Once you input your benefits and costs into the calculator above, it do the rest of the math. This saves you from entering data incorrectly in a spreadsheet and not noticing until it’s too late, after money’s been spent.
First, the number is wrong. It shows gross revenue rather than net cash flow. You might save 10 grand per month with some new piece of software, while paying $2,000/month for subscriptions and support. Your real gain? Eight grand. It looks as if it’ll pay back more quickly, which is a dangerous illusion that comes from using the bigger number.
Get merciless with every incremental expense. What’s the lost productivity during set-up? What is the training time? Consider the energy costs. What about ongoing maintenance? If you’re not accounting for those hidden drains, your projection won’t be worth the paper it’s written on.
Finally, there’s the matter of timing. Not all projects go at full speed immediately. You have to train a sales team through a new process. You need to inspect and connect a solar panel system to the grid. That’s where the ramp-up period comes into play. With this tool, you can model your project on a linear scale-up over a few months. That mimics the messy reality of implementation.
Ignoring the learning curve means assuming full benefit from month one, and that changes your break-even date significantly for longer projects. It’s a small detail in your model, but it makes a big difference.
To see if those long-delayed returns are really worth it, calculate the discounted payback. Future dollars aren’t as valuable as today’s, not due to any moral judgment about time, but simply because they’re subject to opportunity cost and inflation. A dollar in five years won’t buy as much as a dollar you have in your hand today. By applying a discount rate to every month’s cash flow, the calculator shows you its present value: Will waiting for this investment cost you? Is delaying actualy a penalty you can bear? If the simple payback comes out to two years but the discounted one clocks in at three, that margin represent the price of postponement. The cost of waiting may be the difference between saying yes and saying no.
Second, contrast it with the asset’s useful life. Does it make sense that you recoup your investment in 48 months when the machine will be good for a decade? No. That’s awesome! But does it make sense when the machine breaks down within six months? No, that’s awful!
Here’s how that breaks down by category (a handy reference table found here): How long do various kinds of investments typically last? The closer you get to zero, the point at which there’s no more time remaining to reap profits, the greater the risk. When you’ve broken even and now you’ve got six months left before the asset reaches the end of its useful life … well, you don’t have any room for mistakes.
And last but not least: use the reserve input as a sanity check. It’s a way of accounting for the fact that things will overrun. Every project costs more than the quoted price. The higher the original amount, the harder you have to work to make a compelling case for spending money. So inflate the original number by ten or fifteen percent and make yourself prove that it’ll pay off, even then. You should of slept easy if it does. Otherwise go get more data before you sign that check; there might be something wrong.
Assign a return date to every dollar. If you don’t have one, you’re not investing. You’re spending. And you aren’t trying to make money someday. You’re trying to stay in the game long enough to collect it while keeping your cash flow healthy enough to do so.