Discounted Payback Period Calculator
Estimate when an investment recovers its initial outlay after discounting each expected cash flow. The calculator compares discounted payback, simple payback, net present value, discounted recovery ratio, and the exact crossing period.
🎯Investment Presets
🧮Discounted Cash Flow Inputs
Category changes interpretation notes and benchmark tables.
Annual discount rate is converted to the selected period rate.
The pattern generates the forecast row by row.
Start and mid-period timing discount cash flows less heavily.
Enter the upfront amount paid at time zero.
Use net operating benefit before discounting.
Use the required return or hurdle rate.
Applied each period before pattern adjustments.
Monthly models allow up to 60 periods for a five-year view.
Use salvage value or released working capital if realistic.
Reduces each operating cash flow to stress-test uncertainty.
Display only; calculations are unit-neutral.
🔢Current Recovery Snapshot
📋Discounted Cash Flow Schedule
| Period | Cash Flow | Discount Factor | Discounted Cash Flow | Cumulative DCF | Recovery Status |
|---|---|---|---|---|---|
| 1 | $22,000 | 0.9091 | $20,000 | -$65,000 | Open |
📚Project Benchmark Grid
📈Preset Cash Flow Examples
| Scenario | Outlay | First Cash Flow | Discount Rate | Pattern | Horizon | Typical Read |
|---|---|---|---|---|---|---|
| Solar battery upgrade | $18,500 | $3,900 yearly | 7.5% | Efficiency fade | 8 years | Long but stable |
| SaaS workflow tool | $42,000 | $5,800 monthly | 14% | Ramp-up | 18 months | Fast if adoption holds |
| Rental renovation | $64,000 | $13,400 yearly | 8.5% | Steady growth | 8 years | Check terminal value |
| CNC machine cell | $210,000 | $58,000 yearly | 11% | Step-up | 7 years | Capacity-driven |
| Warehouse robot | $155,000 | $18,000 quarterly | 12% | Ramp-up | 20 quarters | Mid-term recovery |
| Clinic imaging unit | $320,000 | $82,000 yearly | 9% | Level | 7 years | Volume-sensitive |
| Delivery van route | $74,000 | $4,900 monthly | 10.5% | Seasonal lift | 30 months | Route economics |
| Energy efficiency retrofit | $96,000 | $22,500 yearly | 6.5% | Efficiency fade | 9 years | Rate-sensitive |
| Product launch tooling | $128,000 | $26,000 yearly | 16% | Ramp-up | 6 years | Risk-adjusted |
🧭Discount Rate Reference
| Annual Rate | Annual Factor Y1 | Quarterly Rate | Monthly Rate | Use Case |
|---|---|---|---|---|
| 5% | 0.9524 | 1.23% | 0.407% | Low-risk asset or utility savings |
| 8% | 0.9259 | 1.94% | 0.643% | Stable operating investment |
| 10% | 0.9091 | 2.41% | 0.797% | Common hurdle rate screen |
| 12% | 0.8929 | 2.87% | 0.949% | Capacity or equipment decision |
| 15% | 0.8696 | 3.56% | 1.171% | Growth project with execution risk |
| 20% | 0.8333 | 4.66% | 1.531% | Early-stage or volatile project |
⚖Payback Interpretation Reference
| Discounted Payback Result | NPV Pattern | Recovery Ratio | Plain Reading | Next Check |
|---|---|---|---|---|
| Recovered before half of horizon | Usually positive | Above 1.25x | Strong recovery cushion | Validate cash flow source |
| Recovered before horizon end | Positive or near zero | 1.00x to 1.25x | Acceptable timing screen | Compare to strategic fit |
| Recovered only with terminal value | Depends on exit value | Near 1.00x | Terminal value is doing the work | Stress-test recovery amount |
| Not recovered within horizon | Often negative | Below 1.00x | Cash flows are too delayed or small | Improve economics or reject |
| Simple payback much faster | Can still be weak | Rate-sensitive | Discounting materially changes the view | Review hurdle rate assumption |
| Payback after asset life | Not compelling | Below 1.00x | Recovery arrives too late | Shorten horizon or reduce outlay |
🔍Formula and Method
💡Practical Discounted Payback Tips
The CNC machine is purchased. The warehouse robot is leased. The solar battery upgrade have been wired. Now, you sit and wait for those investments to begin paying you back. The thrill of the purchase dissapears fast when first month’s worth of bills roll through. When will money begin flowing back?
Finance calls this the payback period, the moment when you get your investment back. But the standard payback period are blind to single most powerful force in investing: time. A dollar received today is worth more then a dollar received next year; otherwise, you’d invest it today.
How to Use the Discounted Payback Calculator
Enter the discounted payback period, an adjustment that corrects this blind spot by bringing your future cash flows into todays value. Here’s the tool (above) running that math for you, crunching the big numbers once you feed it your upfront cost and expected returns.
Enter your expected return and your upfront cost into it. Then let it apply magic of discount rate to all those payments in the future. Your hurdle, the rate at which it discounts all those future payments, is minimum return you require in order to feel comfortabley.
Maybe your bank offer four percent? Use it. Maybe you’re betting on a risky new product launch? Demand fifteen percent.
The calculator use that rate as its hammer, shrinking each of those future cash flows accordingly. Why shrink ’em? Because cash we recieve now has more power then cash we’ll receive in year five.
After the numbers gets shrunken, the calculator adds them up individually. It keeps adding until sum of all its income equals or exceeds our original cost. When it happens, that is your discounted payback. Usually, it will be later than your simple payback date.
The difference between the two will reveal just how much the time value of money are costing you.
Simple math beats complicated math. Most people gets the discount rate wrong. What’s your cost of capital? Use that as a floor. If you’re borrowing money at an 8 percent interest rate, then that’s your rate. Otherwise, what could your cash be earning somewhere else?
Enter that rate into the calculator and play around with it. See how sensitive your project is to the rate. Sometimes changing rates a couple of percentage points will move recovery date by months.
Also, be sure to reduce your estimated cash flow. Nobody gets these estimates actualy correct. If you estimate you’ll save $20k in energy costs, say you’ll only save $18k. That acts as a stress test for your project. Does it hold up under real conditions?
One other gotcha is terminal value input. Far too many analyst fudge the last year by adding some ridiculous sale price so they can make the numbers add up. Don’t do that. Tell it like it really is.
The outcome also hinges on assumptions about timing. Rarely do you receive cash on a particular day. Projects may pay monthly. Or they may pay quarterly. Set frequency in the calculator. Money received sooner, on average, discounts less steeply (cash flows from month-to-month). That little shift can compress the payback period. A small thing, but it makes all the difference on close calls.
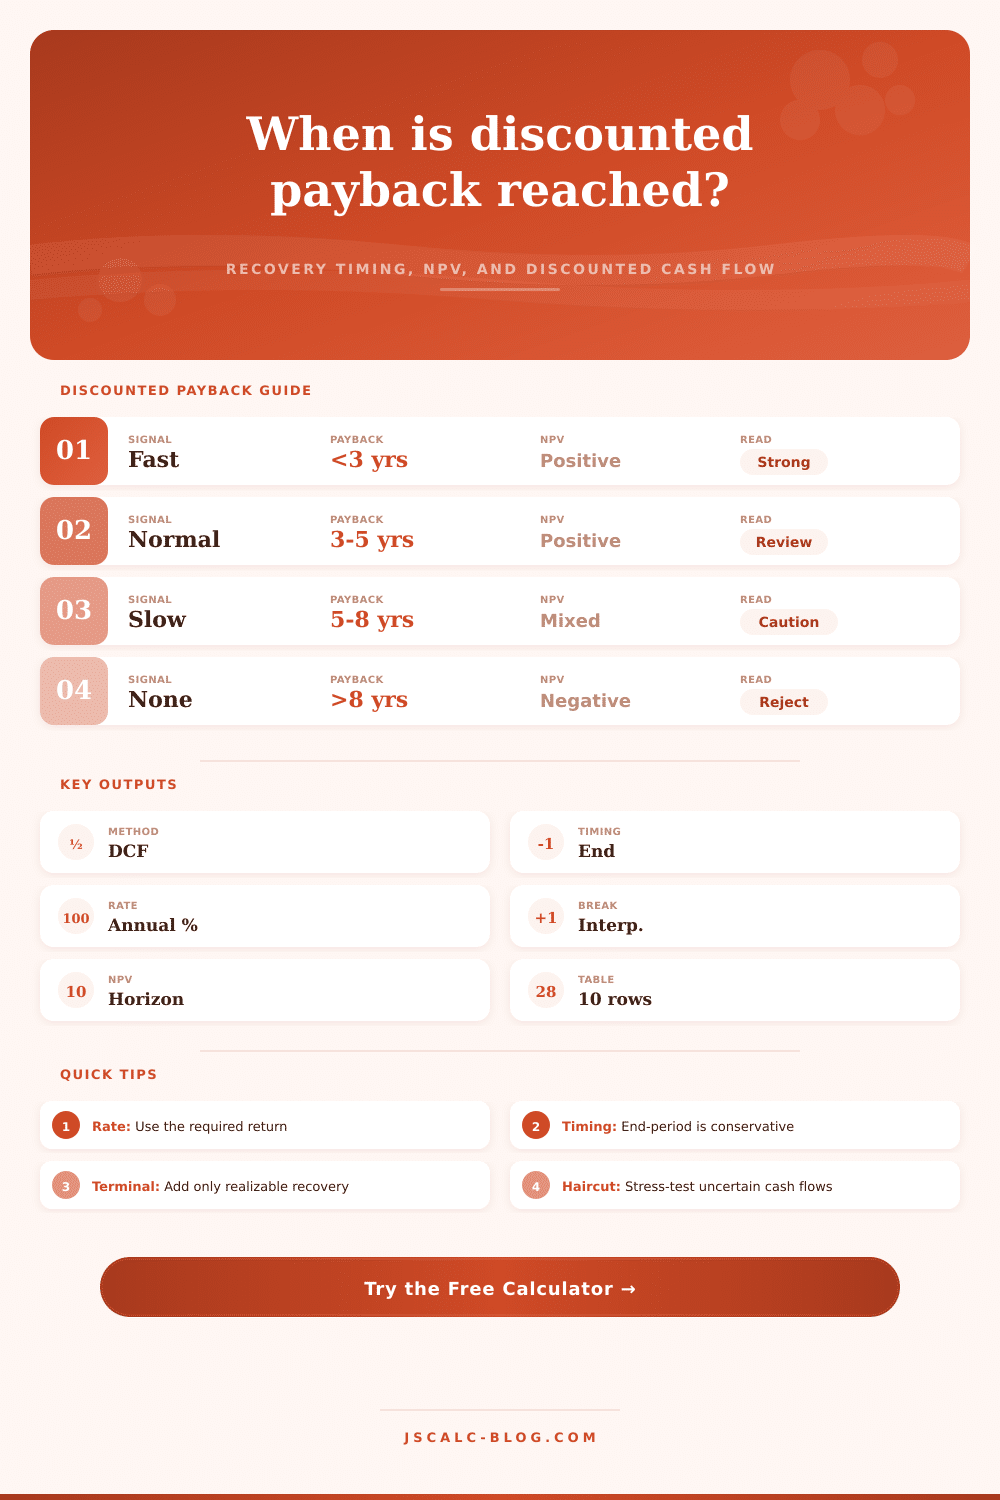
Also, compare the discounted outcome with industry benchmarks. Generally, software tools has to pay back within two years. Real estate might take six. These are context cues found in reference tables on the page. They help you assess whether your outcome is fast or slow compared to the sector.
Don’t just stare at the number. Stare at what the number means for your risk tolerance. Profitable projects can have horrible payback periods. Speed is measured by payback, total wealth isn’t.
Investing in some long haul infrastructure project might require ten years of losses before it break even. But it may make billions during the next three decades. On the flip side, a high-payback project may indicate low total returns.
Look at both: the payback and the net present value. The payback shows you time, how many years you’ll be exposed to the risks. The NPV shows you total return… How much total value this will create. You want to see both metrics. One metric alone give you an incomplete picture. It’s like seeing one piece of your dashboard.
Money wants out fast. And it wants out big. So, when you invest, you’re not only seeking profit; you’re seeking patience. That’s where the discounted payback period comes in. It understands value doesn’t grow overnight. It values the wait and the risk you took during that wait.
Let the numbers tell you where that sweet spot lies. And then let your judgment protect you from yourself. Use the calculator here.