Profitability Index Calculator
Rank capital projects by dividing the present value of future cash inflows by the initial investment. The calculator also reports NPV, discounted payback, discounted benefit multiple, and year-by-year present value detail.
🎯Project Presets
🧮Cash Flow Inputs
Currency changes labels only; the ratio is unitless.
Category supplies a benchmark discount rate and interpretation note.
Use the full upfront outlay, including installation and launch spend.
Set to the project hurdle rate, WACC, or risk-adjusted rate.
Mid-year timing discounts each annual cash flow by half a year less.
Add recovered deposits, working capital, or disposal value separately.
Net operating benefit after incremental operating expense.
Use after-tax cash flow if comparing corporate capital projects.
Keep financing payments out unless your policy requires them.
Enter negative values for scheduled overhaul or loss years.
Year 5 is combined with the terminal or recovered value.
Used to show how much of a limited capital pool this project consumes.
📊Current Project Snapshot
📐Formula Breakdown
📋Preset Comparison Grid
| Scenario | Investment | Rate | Cash Flow Shape | PV Inflows | PI Range | Decision Use | Watch Item |
|---|---|---|---|---|---|---|---|
| Solar retrofit | 250,000 | 8.0% | Stable savings | Five annual benefits | 1.10 to 1.30 | Energy capital screen | Panel output degradation |
| SaaS feature launch | 180,000 | 14.0% | Fast ramp | Growing subscription cash flow | 1.20+ | Product roadmap ranking | Retention assumptions |
| Factory automation | 900,000 | 11.5% | Labor savings | Large steady efficiency gains | 1.00 to 1.20 | Operations approval | Maintenance downtime |
| Store expansion | 520,000 | 12.0% | Slow ramp | Opening-year drag, later growth | 0.90 to 1.15 | Site selection review | Ramp speed |
| Equipment replacement | 310,000 | 9.5% | Immediate savings | Higher early reliability benefits | 1.10+ | Replace versus repair | Residual value |
| Warehouse upgrade | 430,000 | 10.5% | Capacity release | Balanced throughput gains | 1.00 to 1.25 | Logistics investment | Volume forecast |
| Mobile app build | 350,000 | 16.0% | Back-loaded | Small first year, bigger later | 0.85 to 1.20 | Digital portfolio choice | Adoption curve |
| Clinic imaging suite | 760,000 | 10.0% | Utilization ramp | Steady service contribution | 1.00 to 1.18 | Capacity planning | Referral volume |
| Training platform | 120,000 | 13.0% | Small scalable | Learning savings and retention | 1.15+ | People systems screen | Usage rate |
🧭Profitability Index Decision Reference
| PI Range | NPV Pattern | Capital Rationing Read | Plain Decision | Next Check |
|---|---|---|---|---|
| 1.50 and above | Strongly positive | Very high value per unit invested | Rank near the top | Stress-test assumptions |
| 1.20 to 1.49 | Positive | Attractive use of scarce capital | Usually strong | Compare scale with NPV |
| 1.00 to 1.19 | Slightly positive | Acceptable but not dominant | Approve if strategic | Review risk and capacity |
| 0.90 to 0.99 | Slightly negative | Close to the hurdle line | Revise or defer | Improve cash flow timing |
| Below 0.90 | Negative | Poor value per unit invested | Reject or redesign | Check for missing benefits |
| High PI, low NPV | Small positive | Efficient but small project | Useful filler project | Do not ignore scale |
⏱Discount Factor Quick Table
| Annual Rate | Year 1 | Year 2 | Year 3 | Year 4 | Year 5 |
|---|---|---|---|---|---|
| 6% | 0.9434 | 0.8900 | 0.8396 | 0.7921 | 0.7473 |
| 8% | 0.9259 | 0.8573 | 0.7938 | 0.7350 | 0.6806 |
| 10% | 0.9091 | 0.8264 | 0.7513 | 0.6830 | 0.6209 |
| 12% | 0.8929 | 0.7972 | 0.7118 | 0.6355 | 0.5674 |
| 15% | 0.8696 | 0.7561 | 0.6575 | 0.5718 | 0.4972 |
| 20% | 0.8333 | 0.6944 | 0.5787 | 0.4823 | 0.4019 |
🔍Project Category Benchmarks
| Category | Typical Rate Input | Cash Flow Pattern | PI Use | Primary Risk |
|---|---|---|---|---|
| Efficiency or savings | 8% to 11% | Stable annual benefits | Good for rationing similar projects | Savings overstatement |
| Growth investment | 12% to 18% | Ramp then plateau | Compares growth bets with different sizes | Revenue timing |
| Asset replacement | 8% to 12% | Avoided expense plus residual value | Shows value beyond repair choice | Downtime assumption |
| Capacity expansion | 10% to 15% | Volume-driven gains | Ranks bottleneck projects | Demand forecast |
| Digital product | 14% to 25% | Uncertain adoption curve | Useful with scenario presets | Churn and adoption |
| Compliance or reliability | 6% to 10% | Avoided losses and continuity | Pairs with nonfinancial requirements | Hard-to-measure benefits |
💡Profitability Index Tips
Here’s the example: You’ve got three potential projects that require funding: a must-do facility expansion, a potentially huge new product launch (but risky), and an efficiency upgrade that is sure to pay off but isn’t as large as those other two. How do you know which one to fund?
The profitability index shows you the answer, it’s not just about scale; it’s also about how efficient your business will be with each dollar spent. When cash are scarce, this is valuable information.
How to Use the Profitability Index to Choose Projects
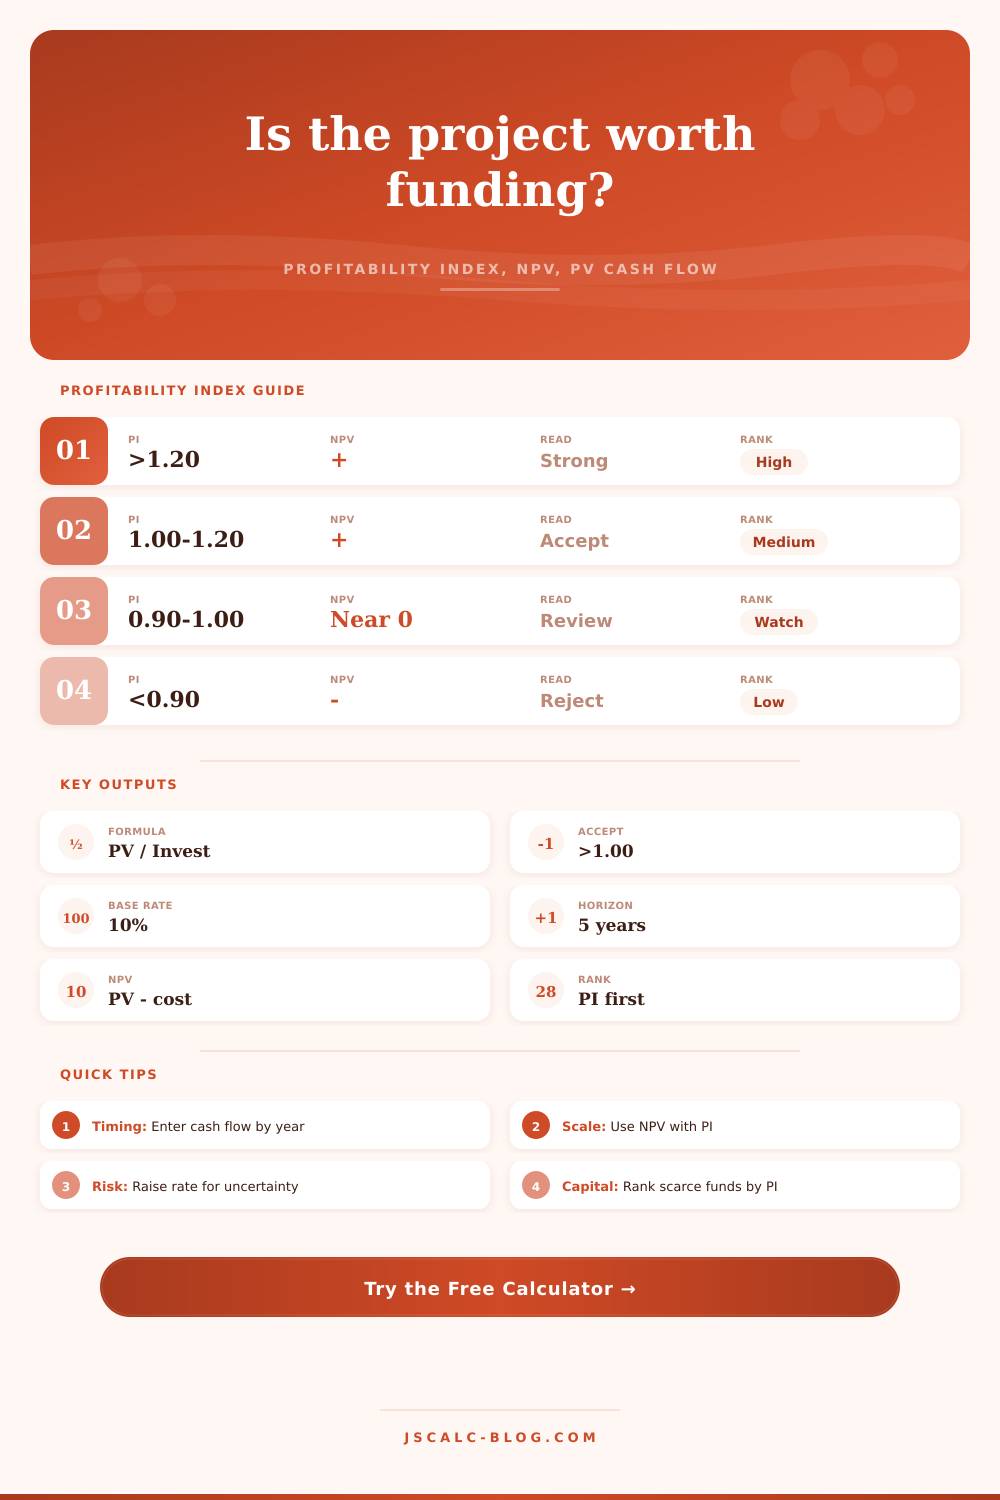
The math itself are straightforward. Simply divide present value of all future cash flows by your initial investment. Anything greater than one indicates value creation; anything less than one indicate value destruction. By letting the calculator perform that calculation for you, you’re free to spend time making decisions rather than calculating them.
A ratio of one point two indicates you recieve a dozen pennies in value for each dollar invested. A good return. A ratio of zero point eight implies you’ll lose two dimes on the dollar. Knowing how to calculate this ratio will keep you from burning cash.
The reason most people gets trapped: They look at a small project that has a huge profitability index and think it’s their best option. That isn’t necessarily the case, a small project could have a two point zero ratio but add just ten thousand dollars to the total profit. A big project could have a one point one ratio, but add a million dollars to the bottom line. You’ll want to see both numbers to understand what your portfolio is creating.
When capital is limited, use the index to rank projects. When you’re trying to figure out how much total wealth a project will create, use net present value. The calculator presents these for you side by side so you can visualize the tradeoff.
It’s not some number pulled out of thin air, it’s the discount rate that you apply. The discount rate reflects the riskiness of the investment (a risky launch should of had a higher hurdle), as well as the cost of capital (a safe project may deserve a lower rate). Use the same rate for both and you’ll almost certainly overvalue the risky bet.
The tool allow you to vary this rate easily. Raise it a few percent and see what happens to the ratio. If the project fail even when you increase the rate slightly, you’re probably making overly rosy assumptions. Stress-testing the rate is an inexpensive check for bad reasoning.
But there’s also a lot of value given to time, i.e., a dollar in my pocket today is worth more than a dollar in my pocket a year from now. You can adjust when your cash flows occur (beginning/end/middle of year), something you might think doesn’t matter much but does. If you’re running a business that makes money during the course of the year, a mid-year convention tend to paint a more realistic picture and ensures that you don’t overstate the value of any back-loaded projects.
The present value of those far-off dollars shrinks rapidy as your discount rate increases. Also, remember to factor in recovered working capital or terminal value (because that cash counts). At the end of the project, you may get to unload some inventory or sell some equipment, and that cash go into the last year’s equation. Don’t omit it simply because it seems minor; don’t overlook it because there is a place in the tool for it. Small things add up, and can swing a minor project over the goalpost or help validate why a bad idea shouldn’t see the light of day.
There’s no such thing as the right idea; there are only the projects where a dollar will give the highest return on investment. We have limited resources. Where should we spend them?
The profitability index provides you with a framework to compare alternatives and make decisions to match; turning imprecise financial projections into a clear scorecard. Use it to test your assumptions and present your side of the argument. Just keep in mind: garbage in = garbage out. The math doesn’t lie. Neither should your inputs.
Turn money into growth, not just move money from place to place.