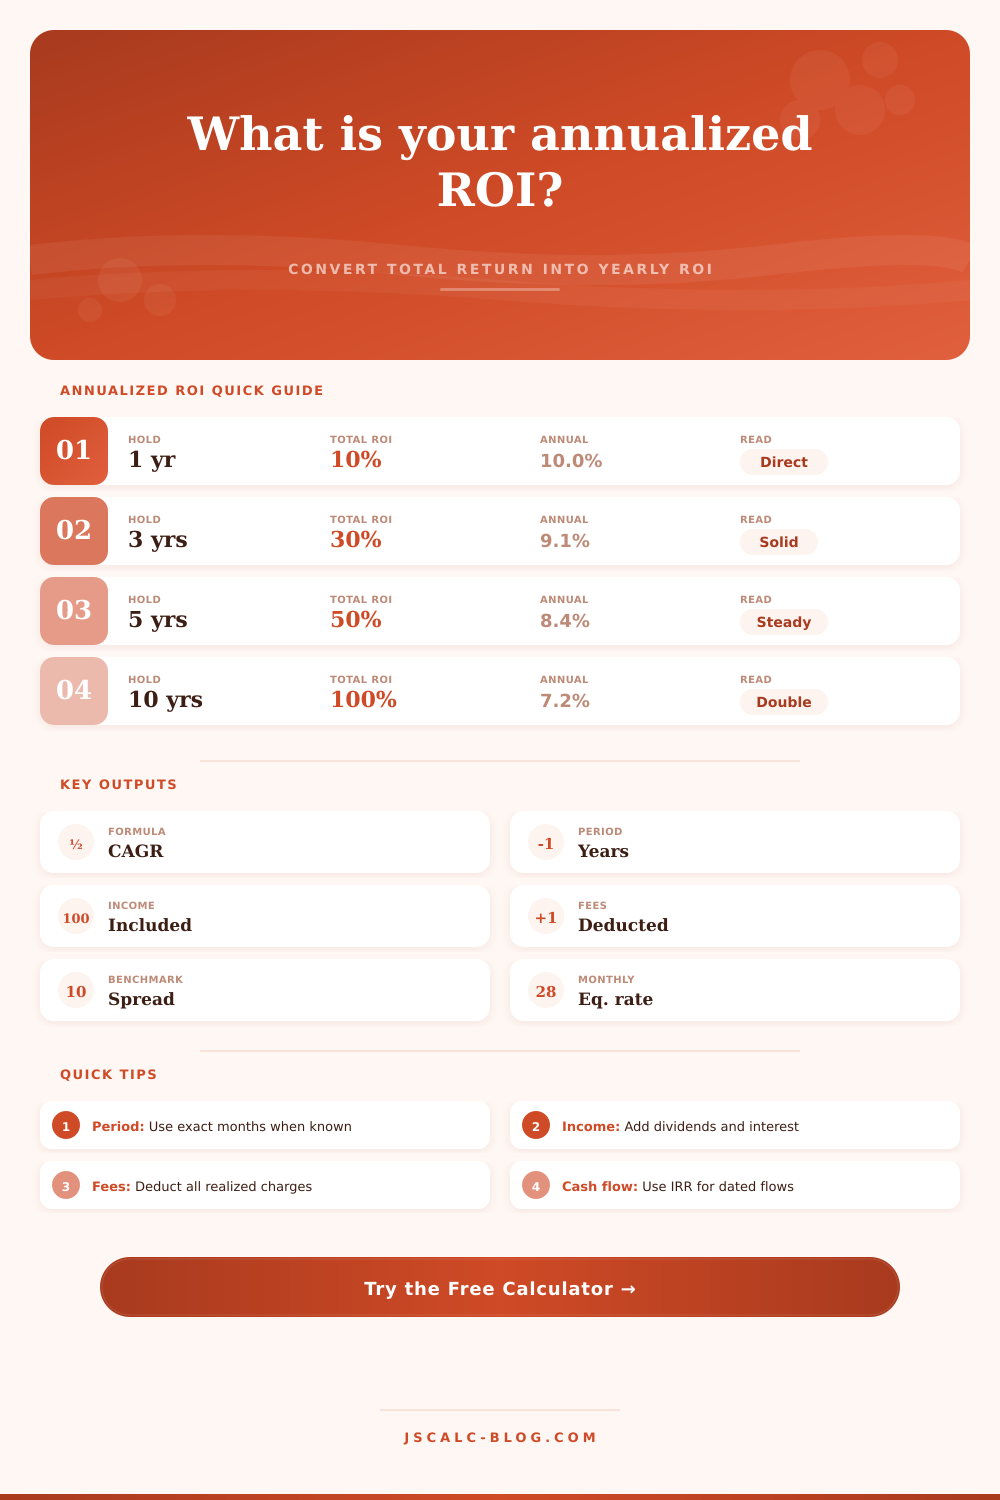
Annualized ROI Calculator
Convert a holding-period return into an annualized rate using investment value, income received, fees, taxes, outside capital, and exact time held.
🎯Annualized ROI Presets
🧮Investment Return Inputs
Category changes reference context and comparison wording.
The spread card compares annualized ROI with this hurdle.
Capital value at the start of the holding period.
Current value, sale proceeds, or exit value before outside cash.
Dividends, interest, distributions, rent net of operating activity, or coupons.
Use realized friction that should reduce the investor return.
Extra contributions after the start date.
Principal returned before the ending value measurement.
Used for the capital-adjusted exposure estimate.
Whole years in the holding period.
Add partial-year months for a more exact annualization.
Optional day count; 365.25 days equals one year.
This converts the annualized ROI into a comparable period rate.
📊Current ROI Snapshot
📐Annualized ROI Formula Breakdown
🧭Return Category Reference
📋Preset Scenario Comparison
| Scenario | Start | Ending | Income | Fees/Taxes | Period | Total ROI | Annualized Read |
|---|---|---|---|---|---|---|---|
| Index fund growth | 25,000 | 38,250 | 1,650 | 420 | 4.5 yrs | 57.92% | 10.70% yearly compound |
| Rental equity exit | 80,000 | 126,000 | 18,500 | 6,900 | 6 yrs | 72.00% | 9.45% before dated cash-flow IRR |
| Dividend stock hold | 12,000 | 15,900 | 2,240 | 310 | 3.25 yrs | 48.58% | 12.96% annualized return |
| Business project payoff | 45,000 | 74,000 | 9,500 | 2,800 | 2.5 yrs | 79.33% | 26.19% project-style return |
| Crypto swing trade | 9,500 | 13,800 | 0 | 680 | 0.67 yrs | 38.11% | 61.90% volatile short hold |
| Bond fund income | 30,000 | 30,900 | 4,650 | 240 | 4 yrs | 17.70% | 4.16% income-heavy return |
| Startup note markup | 20,000 | 52,000 | 0 | 1,400 | 5.5 yrs | 153.00% | 18.36% illiquid markup |
| Cash ladder return | 50,000 | 50,000 | 5,950 | 260 | 3 yrs | 11.38% | 3.66% stable yield |
| Recovery from loss | 18,000 | 15,750 | 520 | 150 | 2.17 yrs | -10.44% | -4.93% annualized drawdown |
🔢Total Return to Annualized ROI Table
| Total ROI | 1 Year | 3 Years | 5 Years | 10 Years | Meaning |
|---|---|---|---|---|---|
| 10% | 10.00% | 3.23% | 1.92% | 0.96% | Small gain stretched over time |
| 25% | 25.00% | 7.72% | 4.56% | 2.26% | Good short hold, modest decade result |
| 50% | 50.00% | 14.47% | 8.45% | 4.14% | Strong when reached in 3 to 5 years |
| 100% | 100.00% | 25.99% | 14.87% | 7.18% | Capital doubled over the full period |
| 200% | 200.00% | 44.22% | 24.57% | 11.61% | High growth, very timing-sensitive |
| -20% | -20.00% | -7.17% | -4.36% | -2.21% | Annualized loss softens with longer time |
⚖Benchmark and Hurdle Reference
| Benchmark | Annual Hurdle | Best Comparison | Spread Reading | Calculator Setting |
|---|---|---|---|---|
| Cash or T-bill style | 3.5% | Low-volatility cash alternatives | Positive spread means return beat cash | Cash or T-bill style |
| Core bond style | 4.5% | Bond fund or note-like holdings | Useful when income is the main driver | Core bond style |
| Balanced portfolio | 7.0% | Mixed stock and bond allocations | Good middle hurdle for diversified capital | Balanced portfolio |
| Broad equity style | 9.0% | ETF, stock, and public-market exposure | Common long-run equity comparison | Broad equity style |
| Growth target | 12.0% | Concentrated growth or active projects | Demand stronger return for added risk | Growth target |
| Venture target | 18.0% | Startup, private note, or illiquid asset | High hurdle offsets illiquidity and failure risk | Venture target |
🔍Interpretation Checks
| Check | Strong Sign | Watch Sign | Why It Matters | Calculator Output |
|---|---|---|---|---|
| Holding period | At least one full year | Only weeks or months | Short periods can inflate annualized rates | Years held and equivalent rate |
| Income treatment | All distributions included | Only ending value entered | Dividends or coupons can materially change ROI | Income yield snapshot |
| Friction treatment | Fees and taxes deducted | Gross proceeds only | Investor ROI should reflect realized drag | Friction drag snapshot |
| Outside capital | No added capital, or small additions | Large mid-period contributions | CAGR is approximate without dated cash flows | Capital-adjusted annual |
| Benchmark spread | Clearly above hurdle | Close to zero spread | Absolute return may not justify the risk taken | Benchmark spread card |
| Losses | Annual loss is manageable | Return multiple near zero | Very deep losses can make annualization unstable | Total ROI and read label |
💡Annualized ROI Tips
Raw gain makes sense to most investors. Money goes in, money comes out, and whether there’s more money on the way than what went in determine success or failure. For that single snapshot, that intuition is fine. But introduce time to the picture, and this snap-shot logic fall apart. A 50% return within six months appears heroic; the same 50% spread over ten years seem like failing to keep pace with inflation. The distance between these results? Annualization. This tool removes the illusion created by the lump sum; it shows us what our capital’s true compounding power actualy was.
And so we bring a calculator into play. It transform those jumbled total returns into an annualized percentage to compare one investment, such as a bond that paid a stable stream of income, with another, such as a stock that sat motionless for years before suddenly spiking.
How to Calculate Your Real Investment Growth
It is also important to decide what you count as your return in the first place. Some folks only consider the ending market value. The final value of all those shares in their portfolio. They don’t think about the cash they’ve earned through the journey. Rental income? What about interest payments on mortgages? These are dividend checks. These represent real money! This money passed through your fingers and could of been spent or even reinvested. If you leave these out, you’re undercounting your returns.
On the other hand, there was taxes and fees that represented real money that came out of your pockets. This money reduce your compounding capital. A proper analysis will find both of these figures. Add up the income you received, then subtract friction costs. That gives you your true economic gain. This is the numerator of your overall ROI.
The denominator is your net invested capital. It takes into account any additional capital you contributed over time (e.g., if you added cash halfway through, your initial deposit doesn’t reflect your full starting base). The tool allows you to specify any withdrawals and additional capital, ensuring the denominator represent your true amount at risk.
In other words, annualizing relies on time doing most of the work. You need to know how much time your return represents. If it’s six months, that isn’t half of a year; that’s a fraction that will warp your results dramaticly if you don’t take it into account. Over the long haul, there’s a huge gap between the compounded annual growth rate (CAGR) and simply dividing by some number and calling it an “average” per annum. Why? Because with compounding, we assume you reinvested all gains, whereas simple division presumes they just sat around and did nothing. The compound formula is what this calculator spits out as equivalent yearly rate. That’s why we use it (it’s the standard). It smoothes away volatility and shows you the true trend line, so that you can say, “This would represent the equivalent of having gotten X percent per year if our growth had been uniformly smooth.
To judge, however, we need a point of reference, an absolute number against which we can compare our own results. In a vacuum, “ten percent per year” sounds great! It’s middling if you were targeting the S&P 500 during the same time frame. And it sucks ass if you incurred VC-style risk to earn that number. How far above/below your hurdle rate did your annualized ROI land? Is this creating value or is it just renting money? If your return just squeeked past the risk-free rate, then… well, congratulations! You’ve earned nothing for taking any risk at all. Choose a benchmark that reflects your asset class (from cash equivalents to high-growth equity). The spread between your ROI and the hurdle rate will show how much you’re earning, compared to the opportunity cost of your capital.
In my opinion, this card is the most brutally honest in the whole calculator: it makes you face up to what your money could of done. Beware the short holding period. If you turn a month-long return into an annual figure, it will look like a big deal, but statistically speaking, it’s barely relevant. A short timeframe are dominated by market noise. Longer periods give you a better idea of how well annualization predicts future results; the longer the period, the stronger connection. Treat its output as a check of your own work, rather than as a guarantee. It’s a backward-looking metric of efficiency; it doesn’t predict the future. You’ll know how effectively you deployed capital and time in the past, which should help you make better decisions going forward. Adjust your asset allocation and risk tolerance based off this information.
Be specific when inputting dates, and honest regarding cost. When the numbers fall into place, you’re free to concentrate on your next move. You have clear insight into the true value of all your hard work.