Tubing Pressure Drop Calculator
Estimate liquid pressure loss in small-bore tubing with the Darcy–Weisbach equation. It solves velocity, Reynolds number, and friction factor, then reports ΔP in psi, bar, and head loss.
💧Real Tubing Presets
📝Flow & Tubing Inputs
Auto-filled by fluid; editing switches to Custom.
1 cSt = 1×10⁻⁶ m²/s. Water 20°C is about 1.0 cSt.
🔢Darcy–Weisbach Terms
🧪Fluid Properties (20°C unless noted)
| Fluid | Density ρ (kg/m³) | Kinematic ν (cSt) | Notes |
|---|---|---|---|
| Water 20°C | 998 | 1.004 | Reference liquid |
| Water 60°C | 983 | 0.475 | Thinner when hot |
| 50% Ethylene glycol | 1113 | 16.0 | Antifreeze mix |
| Engine coolant 50/50 | 1050 | 2.80 | Automotive loop |
| Diesel / fuel oil | 840 | 2.50 | Fuel lines |
| Hydraulic oil VG46 | 870 | 46.0 | At 40°C rating |
| Seawater 20°C | 1025 | 1.05 | Marine systems |
| Whole milk | 1030 | 2.10 | Food-grade lines |
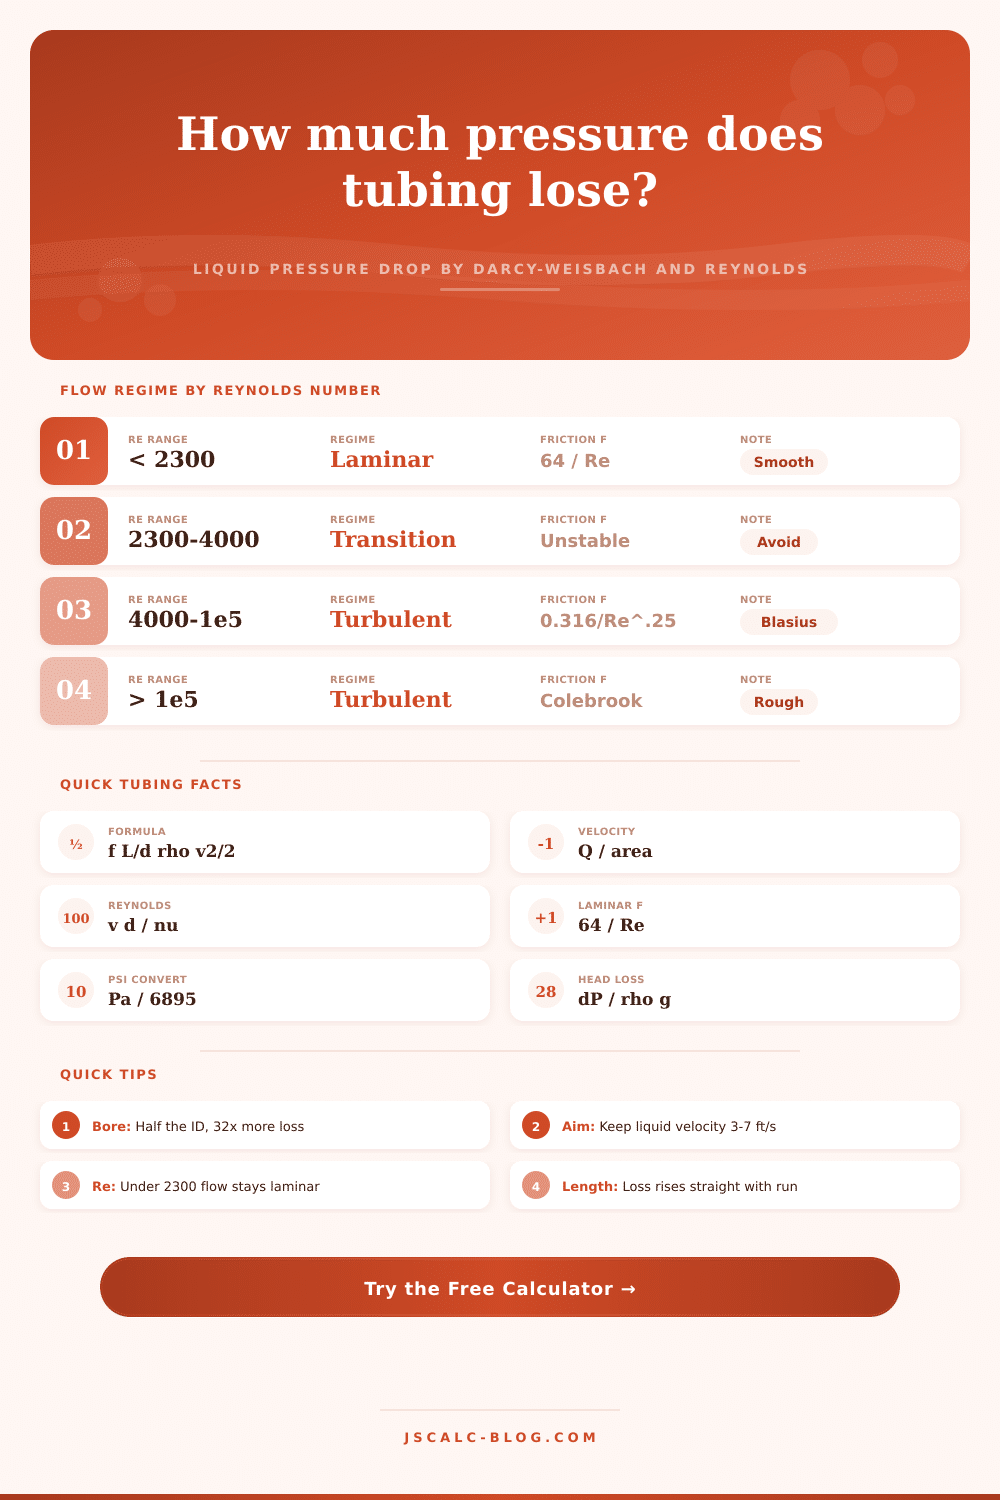
🌊Flow Regime by Reynolds Number
| Re Range | Regime | Friction Factor | What It Means |
|---|---|---|---|
| Below 2300 | Laminar | f = 64 / Re | Smooth layered flow, viscosity rules |
| 2300 – 4000 | Transitional | Unstable | Unpredictable, best avoided in design |
| 4000 – 100,000 | Turbulent | Blasius 0.316/Re^0.25 | Mixing flow, smooth-tube estimate |
| Above 100,000 | Turbulent | Swamee-Jain / Colebrook | Roughness matters, use ε/d method |
📏Tube ID vs Velocity & ΔP (Water 2 GPM, per 10 ft)
| Tube ID | ID (mm) | Velocity (ft/s) | Reynolds | Regime | ΔP per 10 ft (psi) |
|---|---|---|---|---|---|
| 0.125 in | 3.18 | 52.3 | 50,400 | Turbulent | 372 |
| 0.18 in | 4.57 | 25.2 | 35,000 | Turbulent | 65.8 |
| 0.25 in | 6.35 | 13.1 | 25,200 | Turbulent | 13.8 |
| 0.305 in | 7.75 | 8.78 | 20,700 | Turbulent | 5.38 |
| 0.375 in | 9.53 | 5.81 | 16,800 | Turbulent | 2.02 |
| 0.43 in | 10.9 | 4.42 | 14,700 | Turbulent | 1.05 |
| 0.50 in | 12.7 | 3.27 | 12,600 | Turbulent | 0.51 |
| 0.625 in | 15.9 | 2.09 | 10,100 | Turbulent | 0.18 |
| 0.68 in | 17.3 | 1.77 | 9,270 | Turbulent | 0.12 |
| 0.75 in | 19.1 | 1.45 | 8,400 | Turbulent | 0.07 |
⚙Friction Factor Guide
| Reynolds | Method | Darcy f | Comment |
|---|---|---|---|
| 500 | 64 / Re | 0.1280 | Deep laminar, high f |
| 1,000 | 64 / Re | 0.0640 | Laminar, viscous loss |
| 2,000 | 64 / Re | 0.0320 | Upper laminar edge |
| 4,000 | Blasius | 0.0397 | Just turbulent |
| 8,000 | Blasius | 0.0334 | Common tubing range |
| 20,000 | Blasius | 0.0266 | Fast smooth flow |
| 50,000 | Blasius | 0.0211 | Near Blasius limit |
| 100,000 | Swamee-Jain | 0.0178–0.022 | Roughness starts to matter |
📐Full Formula Breakdown
💡Practical Tubing Tips
Pour some water down a slender straw: it squirts right out quickly. Push some thick syrup down the same tube: You don’t even get a drip. Why? Viscosity isn’t the whole answer. It’s also about how fighting to flow between walls kills pressure.
You must design a hydraulic circuit, a coolant loop and a fuel line. In these system, friction adds up. Use the tubing pressure drop calculator above to spot bad designs before buying parts. It will run the math for you. Knowing why the numbers work like they do will help you spot potential problems.
Why Tube Size Matters for Flow
The basic formula used for calculating flow is called the Darcy-Weisbach equation that expresses pressure loss as a function of internal diameter, length of tube, velocity and density of the fluid. While most folks starts with pump size, the shape of tubes determines what the pump needs to overcome. Whether you measure in millimeters or inches, liters per second or gallons per minute, the calculator does all the unit conversion for you. And it gets the standard fluid properties from a built-in library. No need to remember the kinematic viscosity of hydraulic oil at forty degrees Celsius. Just click it and it computes Reynolds number based off it. It saves time and avoids copy-paste errors from datasheets.
So who’s watching? Who says what happens? That would be the little-known Reynolds Number, your best guide to knowing if the flow is turbulent or not. The flow are smooth (laminar) below two thousand three hundred and churns around above four thousand, creating eddies that waste energy as noise and heat. Friction drops predictably as speed increases (viscosity rules), up until point of turbulence when things get very weird.
At that point the calculator switches automatically from one model to another: Laminar, straight up inverse linear relation. Turbulence is more like Swamee-Jain or Blasius, which are empirical relations that take into account roughness of the walls. Many designs blow up here because engineers expect linearity where there isn’t any. Except for diameter, which is more important different than nearly everything else. In turbulent flow, pressure drop is approximately inversely proportional to fifth power of diameter. Diameter matter more than almost any other variable.
Halving the internal bore does not double the loss. It multiplies it by thirty-two times. That is a brutal penalty. It increases it by thirty-two times. Ouch. Even with an oversized pump, a lengthy stretch of narrow-bore tubing can rob so much pressure that it starves components downstream. The table of references on page spells this out: With fixed flow, shrinking tube size raises velocity and drops pressure brutally.
That’s a tradeoff you get to adjust with the lever of speed. For most water-based systems, try to keep it between 3-7 ft/sec. That’s high enough to avoid gas bubbles and stagnation. It is not too fast to cause excessive wear on fittings, vibration and noise or erosion. Too slow and you run into the threat of thermal stratification or sediment settlement. To do it right, the calculator will show you average velocity in real time and let you tweak flow rate or diameter till you find yourself in that sweet spot.
Roughness is commonly overlooked, yet at high Reynolds number it will bite you in the ass. Flexible plastic hose with an inner ridge vs. Corroded steel vs. Smooth copper tubing behaves differently. There’s even a way to enter a roughness coefficient if you’re after precision, although for most new, clean lines, default assumption of smooth tubing is good enough. If you handle abrasive slurries or just have an aging system, that friction factor increases and so does your pressure drop.
Another handy output is head loss. This converts pressure into height of a fluid column. Helps visualize where you’re wasting all that energy just pushing liquid through a pipe. Maybe your pump has a maximum lift of 10 feet of water, but your tubing uses up 8 feet of that lift to overcome friction. That leaves you with 2-feet to contend with fittings and elevation. It is a small thing, but it matters when margins are small.
This isn’t something that requires a degree in fluid dynamics. Just plug in how far your liquid has to travel, how much there is to move, and what sort of liquid it is. Watch as the Reynolds number change. Adjust the diameter until you think the pressure drop is something you can handle. That’s turning abstract equations into working systems.
That is the narrow straw I mentioned before. If the hole is too small, the harder you squeeze, the less you’ll get out. It could of been easier if we knew sooner.