Trihybrid Punnett Square Calculator
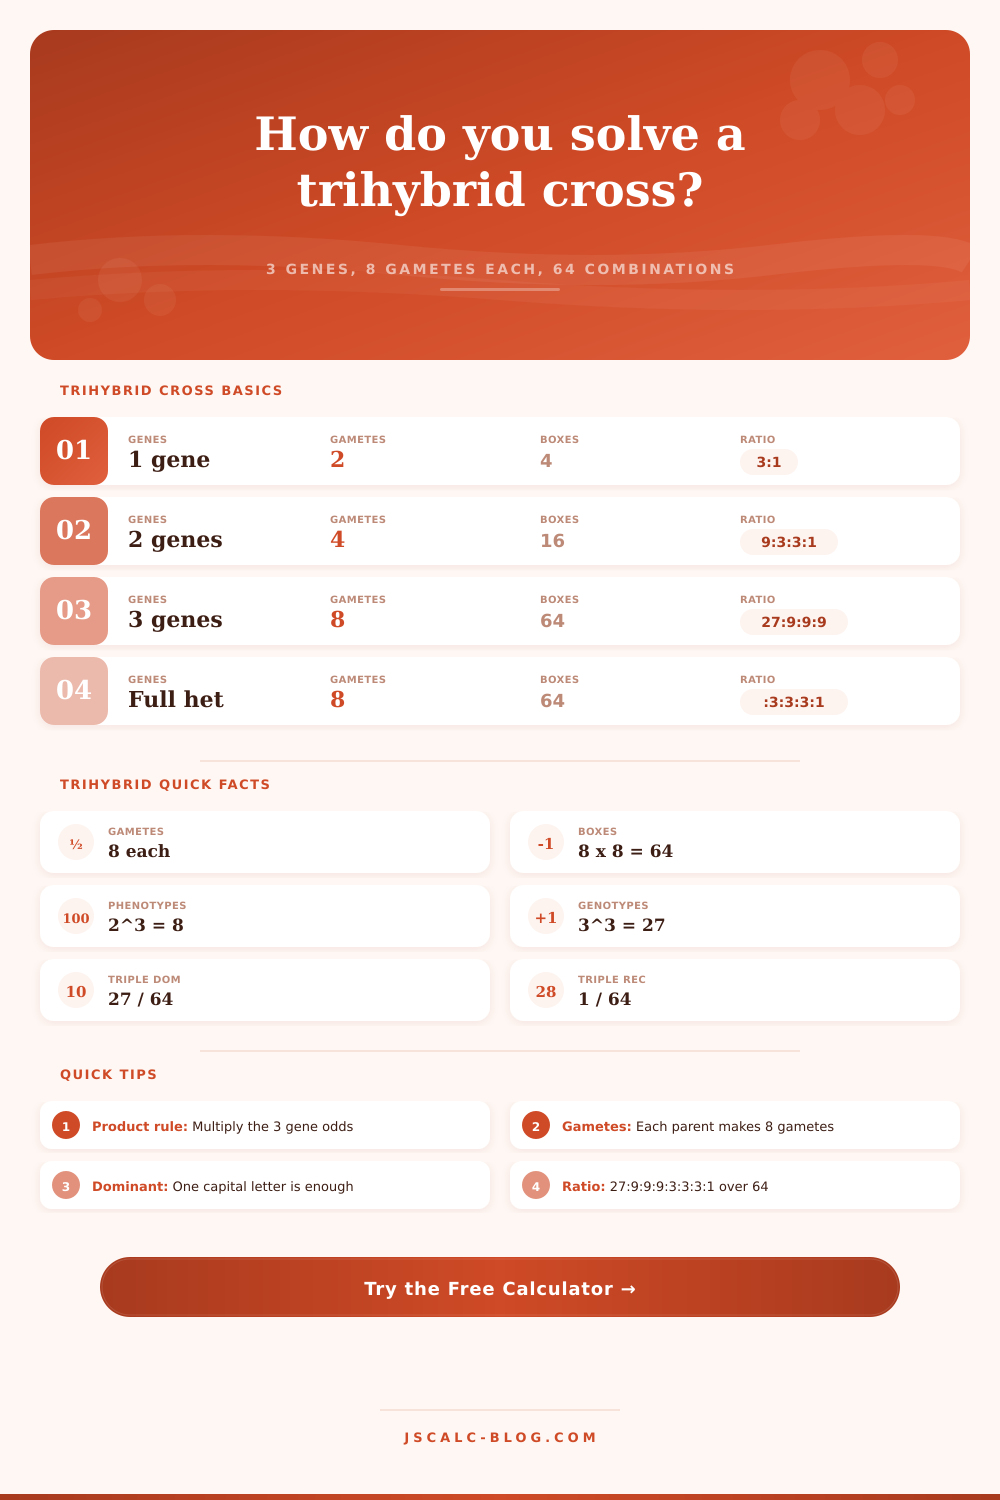
Solve a three-gene cross such as AaBbCc × AaBbCc. Each parent makes 8 gametes for an 8 × 8 grid of 64 offspring, then read the 27:9:9:9:3:3:3:1 phenotype ratio, genotype classes, and any target odds.
🧬Real Trihybrid Presets
📝Cross Inputs
Six letters, two per gene, e.g. AaBbCc.
Match the same gene letters as parent 1.
D = at least one capital, r = both lowercase.
Exact genotype odds, e.g. AaBbCc or AABBCC.
🧪Gametes Produced
📊Phenotype Class Summary
| Phenotype Class | Pattern | Count / 64 | Fraction | Percent |
|---|---|---|---|---|
| Enter genotypes above to build the phenotype summary. | ||||
D means at least one dominant allele for that gene; r means both alleles are recessive.
🔲64-Box Phenotype Grid
| Calculate to build the 8 × 8 grid. |
Rows are parent 1 gametes, columns are parent 2 gametes. Shaded cells are triple-dominant offspring; each cell shows the offspring genotype.
🔢Cross Snapshot
🗂Cross Type Comparison Grid
| Cross Type | Genes | Gametes Each | Combinations | Phenotype Classes | Phenotype Ratio |
|---|---|---|---|---|---|
| Monohybrid | 1 | 2 | 4 | 2 | 3:1 |
| Dihybrid | 2 | 4 | 16 | 4 | 9:3:3:1 |
| Trihybrid | 3 | 8 | 64 | 8 | 27:9:9:9:3:3:3:1 |
| Tetrahybrid | 4 | 16 | 256 | 16 | 81:27:...:1 |
| Trihybrid test cross | 3 | 8 vs 1 | 8 | 8 | 1:1:1:1:1:1:1:1 |
| Two hetero, one homo | 3 | 4 shown | 16 | 4 | 9:3:3:1 |
⚖Trihybrid Ratio Reference (27:9:9:9:3:3:3:1)
| Phenotype | Pattern | Count / 64 | Fraction | Product Rule |
|---|---|---|---|---|
| A_ B_ C_ | Dom Dom Dom | 27 | 27/64 | 3/4 × 3/4 × 3/4 |
| A_ B_ cc | Dom Dom rec | 9 | 9/64 | 3/4 × 3/4 × 1/4 |
| A_ bb C_ | Dom rec Dom | 9 | 9/64 | 3/4 × 1/4 × 3/4 |
| aa B_ C_ | rec Dom Dom | 9 | 9/64 | 1/4 × 3/4 × 3/4 |
| A_ bb cc | Dom rec rec | 3 | 3/64 | 3/4 × 1/4 × 1/4 |
| aa B_ cc | rec Dom rec | 3 | 3/64 | 1/4 × 3/4 × 1/4 |
| aa bb C_ | rec rec Dom | 3 | 3/64 | 1/4 × 1/4 × 3/4 |
| aa bb cc | rec rec rec | 1 | 1/64 | 1/4 × 1/4 × 1/4 |
🧮Gamete Count & Class Counts by Gene Number
| Heterozygous Genes | Gametes (2^n) | Combinations (4^n) | Phenotype Classes (2^n) | Genotype Classes (3^n) |
|---|---|---|---|---|
| 1 | 2 | 4 | 2 | 3 |
| 2 | 4 | 16 | 4 | 9 |
| 3 | 8 | 64 | 8 | 27 |
| 4 | 16 | 256 | 16 | 81 |
| 5 | 32 | 1,024 | 32 | 243 |
| n | 2^n | 4^n | 2^n | 3^n |
📐Single-Gene Probability Rules
| Cross Per Gene | Dominant Odds | Recessive Odds | Genotype Split |
|---|---|---|---|
| Aa × Aa | 3/4 | 1/4 | 1 AA : 2 Aa : 1 aa |
| Aa × aa | 1/2 | 1/2 | 1 Aa : 1 aa |
| Aa × AA | 1 | 0 | 1 AA : 1 Aa |
| AA × aa | 1 | 0 | all Aa |
| AA × AA | 1 | 0 | all AA |
| aa × aa | 0 | 1 | all aa |
⚙How The Cross Is Solved
💡Trihybrid Tips
Mendel started with some single-gene characteristics of his peas… Seed shape or flower color, for example. The resulting crosses, called monohybrids, follow a clear three-to-one ratio: tidy math, as if nature were almost following a recipe. Add another gene and the grid gets bigger… At least sixteen boxes, but still not too bad if your hand can hold still and you has the time to be patient.
Introduce a third gene, though, and everything shifts visually. Now there is a landscape of sixty-four different combinations on an eight by eight grid that you face all at once. This is where many teachers groan (and where most students pause); complexity have moved beyond an abstract bit of arithmetic into something requiring true organization.
Why Three-Gene Crosses Are Harder
To do this at a larger scale, the calculator does the hard work for you. Simply input your parent genotypes (typically six characters, or three different gene pairs), and it will spit out eight possible gametes from each individual. From there it lays it all out in all its glory: a complete sixty-four box diagram of every single possible offspring.
And this is where the visualization is important, because it makes you stare at the fact that there’s just a lot going on here genetically. The grid fills up, and suddenly you’re thinking, oh yeah. It isn’t wrong to have diversity, it’s statistically expected. There is no right answer, only a range of possibilities with various combinations of traits.
What really makes this powerful is when you realize that all those little boxes can be collapsed into phenotype classes. With two triple heterozygous parents in a normal cross, you should expect to see eight different phenotypes appear in the data. You’d find 27:9:9:9:3:3:3:1 (that’s twenty-seven to nine to nine to nine to three to three to three and one) with that classical ratio.
It sounds scary, I know, but it all falls into place in a predictable way because of independent assortment. When making your gametes, each gene goes its own way, pod shape doesn’t affect plant height which doesn’t affect seed color. The calculator breaks it down nicely, tells you how many offspring end up in each box and turns a bunch of numbers into something you can read and understand, probabilities.
Sometimes you don’t have to draw out each box to figure it out. Seasoned geneticists skip all this drawing out of boxes, relying on what they call the product rule. Here’s how that works: If there’s a 75% chance that something is going to happen with a given gene, you multiply that percentage by itself three times (to represent the possibility of having the trait be dominant for all three genes).
So the likelihood that your offspring will show the dominant trait for all three genes is 3/4 x 3/4 x 3/4 = 27/64, which equals roughly 42 percent. There are similar calculations for each individual gene, and set of reference tables included with the tool spell them out in case you want to check the math that way. Why? Because they’re independent events; a coin toss doesn’t affect the next one’s chances.
This makes genetic crosses make more sense. If a cross has an unusually high percentage of triple-dominants, this doesn’t necessarily indicate that all of them will have the exact same phenotype. Rather, it indicates that their phenotype on those three genes will match: they’ll all look the same, but under the hood they may have very different genotypes. They may be homozygous dominant, while others may be heterozygotes who carry recessive alleles hidden from sight that can re-surface later.
These two concepts, phenotype vs. Genotypes are subtle but important. You can use the tool to drill down into particular genotypes if you want to identify carriers or to plan your next round of breeding in detail.
The thing is, most folks fixate on the grid itself: its dimensions. Sixty-four cells! How could I possibly not mess up? The trouble is they aren’t paying attention to the mathematics based off it. That’s where the product rule comes in. It allows you to avoid this anxiety by focusing less on the tedium of counting and more on probability.
Instead of drawing boxes, you’re beginning to think in terms of multiplication and fractions. It’s a mind-set that can make increasingly complicated crosses seem within reach. If you can wrap your head around the idea of three genes with some practice, four or five are simply an extension of the same principle.
In the end though, there’s no need to memorize any ratio because getting good at doing trihybrid crosses relies on having faith in the math that makes them work. Meiosis will be as random as it wants, but there’s predictability in its chaos. The same rules apply whether we’re talking about simple biological concepts or farming characteristics.
Today, we have the tools to make the math easy, leaving us time to ask what our answer means for our particular situation. What does this say about how genes influence life? And how do they do that one combination at a time? It starts with that grid of 64 boxes, but you are the explorer traveling the territory.