Punnett Square Calculator
Solve a monohybrid or dihybrid genetic cross. Enter two parent genotypes to build the offspring grid, then read the genotype ratio, phenotype ratio, and percent dominant and recessive for every combination.
🧬Real Cross Presets
📝Cross Inputs
One letter for monohybrid (A), two for dihybrid (AB).
2 alleles per gene, e.g. Aa or AaBb.
Uppercase = dominant, lowercase = recessive.
Used for dihybrid crosses only.
Used for dihybrid crosses only.
Offspring Punnett Grid
🔢How The Grid Is Built
📊Monohybrid Ratio Reference
| Cross | Genotypes | Genotype Ratio | Phenotype Ratio | % Dominant |
|---|---|---|---|---|
| AA × AA | All AA | 1 (all AA) | All dominant | 100% |
| AA × Aa | AA, Aa | 1 AA : 1 Aa | All dominant | 100% |
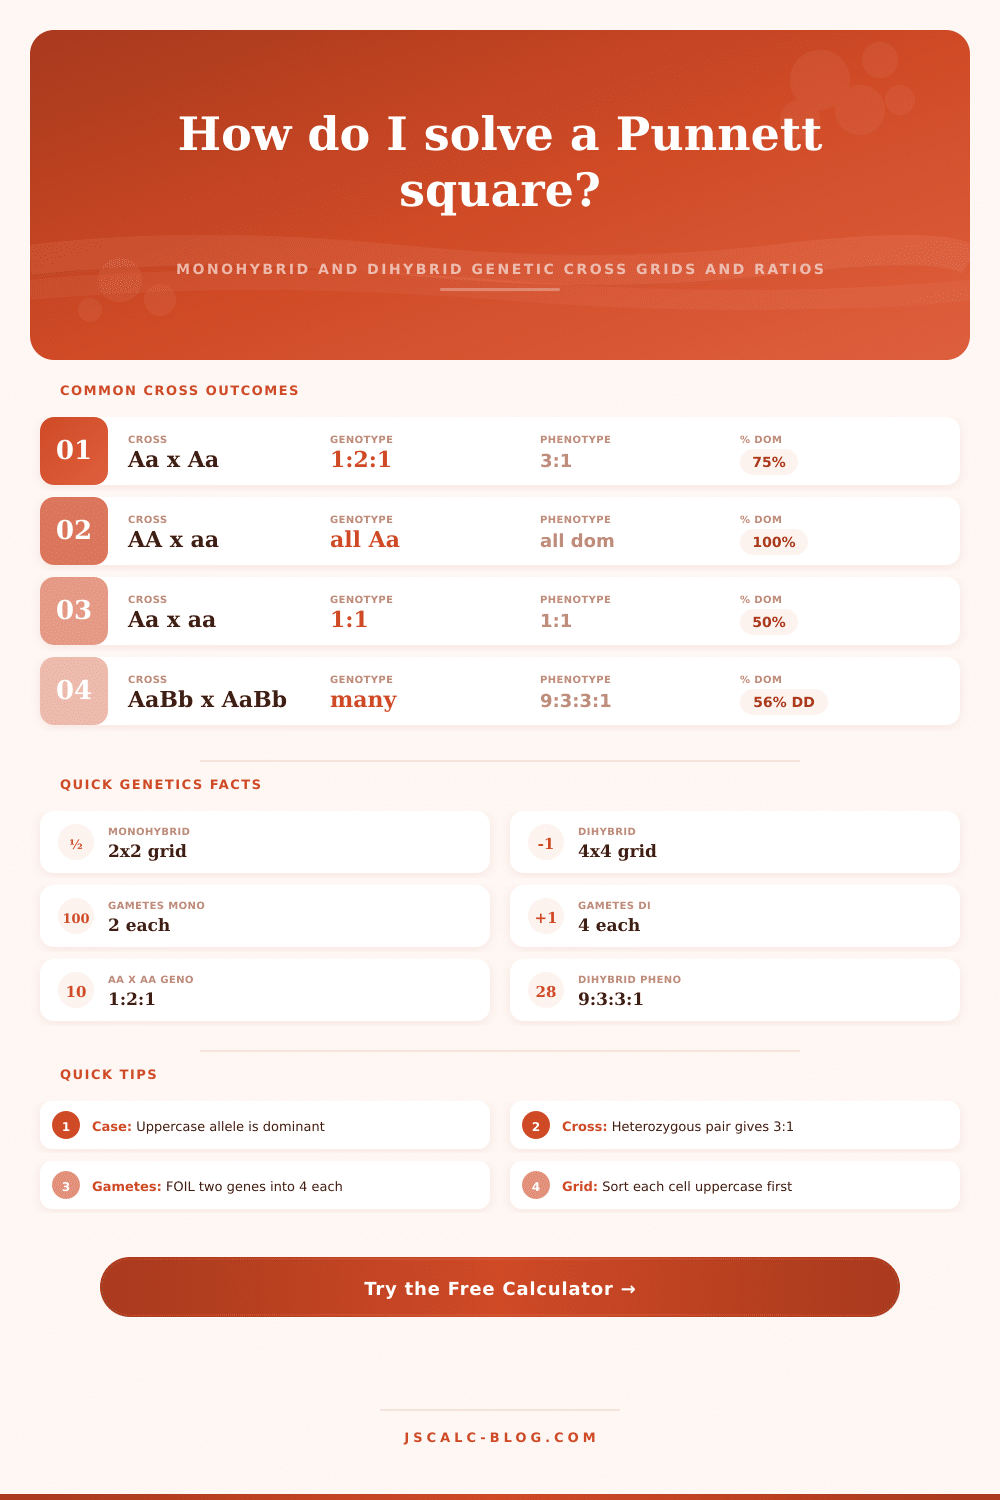
| AA × aa | All Aa | 1 (all Aa) | All dominant | 100% |
| Aa × Aa | AA, Aa, aa | 1 : 2 : 1 | 3 dom : 1 rec | 75% |
| Aa × aa | Aa, aa | 1 Aa : 1 aa | 1 dom : 1 rec | 50% |
| aa × aa | All aa | 1 (all aa) | All recessive | 0% |
🧪Dihybrid 9:3:3:1 Reference
| Phenotype Class | Genotype Pattern | Count Out Of 16 | Fraction | Percent |
|---|---|---|---|---|
| Both dominant | A_ B_ | 9 | 9/16 | 56.25% |
| Dom gene 1, rec gene 2 | A_ bb | 3 | 3/16 | 18.75% |
| Rec gene 1, dom gene 2 | aa B_ | 3 | 3/16 | 18.75% |
| Both recessive | aa bb | 1 | 1/16 | 6.25% |
| Total offspring boxes | All classes | 16 | 16/16 | 100% |
🧬Genotype Vs Phenotype
| Genotype | Zygosity | Alleles | Expressed Phenotype | Carrier? |
|---|---|---|---|---|
| AA | Homozygous dominant | 2 dominant | Dominant trait | No |
| Aa | Heterozygous | 1 dom, 1 rec | Dominant trait | Yes (carrier) |
| aa | Homozygous recessive | 2 recessive | Recessive trait | No (affected) |
| AABB | Homozygous both | 4 dominant | Both dominant | No |
| AaBb | Dihybrid heterozygous | 2 dom, 2 rec | Both dominant | Yes, both genes |
| aabb | Homozygous recessive both | 4 recessive | Both recessive | No (affected) |
🗂Common Cross Comparison Grid
| Cross | Type | Genotype Ratio | Phenotype Ratio | % Dominant | % Recessive |
|---|---|---|---|---|---|
| AA × aa | Monohybrid | All Aa | All dominant | 100% | 0% |
| Aa × Aa | Monohybrid | 1 : 2 : 1 | 3 : 1 | 75% | 25% |
| Aa × aa | Test cross | 1 : 1 | 1 : 1 | 50% | 50% |
| AA × Aa | Monohybrid | 1 : 1 | All dominant | 100% | 0% |
| aa × aa | Monohybrid | All aa | All recessive | 0% | 100% |
| AaBb × AaBb | Dihybrid | 9:3:3:1 classes | 9 : 3 : 3 : 1 | 93.75% one+ | 6.25% both rec |
| AaBb × aabb | Dihybrid test | 1:1:1:1 | 1 : 1 : 1 : 1 | 25% both dom | 25% both rec |
| AABB × aabb | Dihybrid | All AaBb | All both dom | 100% | 0% |
⚙How The Math Works
💡Punnett Square Tips
If your high school biology class made you fill out grids, then you probably already know how to use Punnett square. But if you thought it was tedious before: well, it still is. It’s a shortcut that makes probability visual. It turns the random nature of genetic processes into something that fits into a neat little box (and allow you to visually understand what comes next).
All you have to do is know which letter represent each trait, and the calculator up top will do the math for you. No guessing at conversions or coefficients here. This is where we understand the purpose of uppercase and lowercase letters; they’re not random letters; each represents an allele, or version of a gene. One type (the dominant) can overrides the other (the recessive). When we input Aa into the tool, we’re telling it that this parent have two sets of instructions (but expresses the dominant trait). This is where most people mess up, thinking that recessive letter simply vanishes. But it hasn’t! It’s present in the offspring, just waiting for its match to show up.
What is a Punnett Square?
It’s also easy with something as straightforward as a single gene trait such as eye color or how tall a pea plant will grow. There are only four possible combos. Two sets of alleles, with two from each parent, come together to make these four possibilities. When both parents carry it, the predictable 3-to-1 result occur where three of the four offspring express dominant form and one expresses the recessive form. That was what Mendel observed originally in his garden, a neat result, and is laid out clearly on page’s reference table so you don’t need to memorize all the combinations. Just look them up in the table. What’s the expected outcome of your cross?
Add in a second gene (a dihybrid cross), and it gets interesting. Rather than just following one characteristic (height), you follow two simultaneously: height and seed color. Now instead of a grid with four boxes, there are sixteen. Genetics doesn’t care whether it’s nice and tidy; your brain would like to put similar stuff together. But each time, it all gets shuffled again. That’s where the bigger grid is used. The calculator create it for you and demonstrates what independent assortment does. There are some combinations far more likely then others, and that’s why the 9-to-3-to-3-to-1 is such an iconic ratio. Most offspring look like the dominant phenotype of their parents, and only a tiny fraction carry both recessive traits.
Keep in mind: These squares are predictions of probabilities (not guarantees). Having a 25% probability in the grid doesn’t mean that your next kid will definitely have that genotype. Every fertilization event is an independent trial, and if luck favors you, you might obtain the same outcome multiple times in a row. Nature can surprise us. The tool provides the average result based off infinite trials. This may help you understand risk or plan accordingly, but nature often surprises us.
What confuses a lot of folks is that genotype isn’t the same as phenotype. Genotype refers to actual genetic code (aa, Aa). Phenotype is what you actually observe (short, tall). The calculator will separate those out to help you tell the difference between being a carrier and expressing the gene. That’s important when dealing with medical genetics or breeding programs where hidden carriers has a big impact. You may appear unaffected but still transmit recessive genes to your offspring.
If you’re unfamiliar with the process, then using presets will help. Instead of having to type in all those letters yourself, you click on one of many presets (for any particular plant variety, or a test cross) and it’ll fill in boxes correctly, then run simulation right away. It is a great way to check the calculations that you’ve done by hand, or to play around and see some other scenarios you haven’t thought about. The names of traits can be swapped out to fit whatever you’re exploring: animal, flower, etc., even human blood types.
In the end, though, that’s all the Punnett square is: a map of possibility. It doesn’t dictate an outcome; it merely shows the landscape. And after you’ve had some experience with allele sorting and combination, that square becomes less magical and more mathematical (simple arithmetic). You start to see how diversity can be maintained within a population and why particular traits might remain present. Now, instead of calculator doing the work, you’re left wondering about what those numbers mean. You wonder about what those letters mean when translated into the livig world around us. That’s where the education occurs. It happens in the gap between the math and organism.