Total Compensation Calculator
Estimate the annual value of base salary, bonus, commission, equity vesting, employer benefits, retirement match, and other taxable or non-taxable compensation.
Used for formatting only; values are not exchange-rate converted.
Sets the interpretation note in the formula breakdown.
Use 80 for below-target funding, 120 for above-target funding.
Use 100 for liquid public equity; lower for private or uncertain value.
For a 50% match up to 6%, enter 50, 6, and 6.
| Component | Calculator formula | Included in total comp | Taxable planning note |
|---|---|---|---|
| Base salary | Annual base salary entered | Full annual amount | Usually taxable wages |
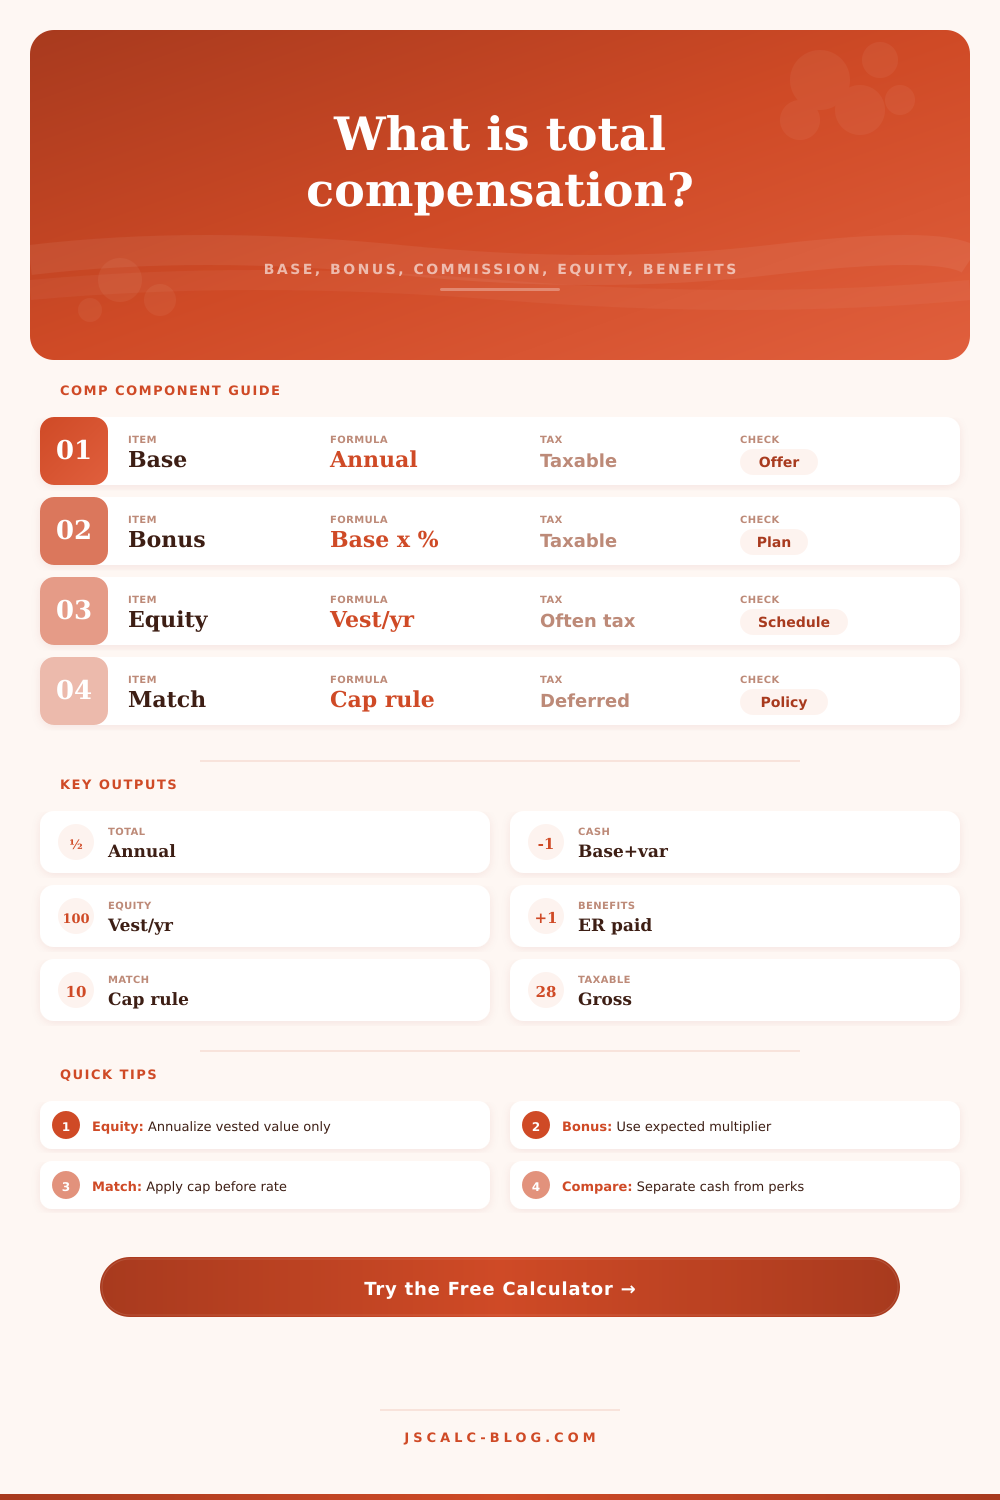
| Bonus | Base x target bonus % x expected multiplier % | Expected annual payout | Usually taxable when paid |
| Commission | Target commission x attainment %, then cap if entered | Expected annual payout | Usually taxable when paid |
| Equity value | Units x share price x annual vesting % x liquidity adjustment % | Annualized vested value | Tax timing depends on award type |
| Employer benefits | Monthly employer-paid benefits x 12 | Employer-paid plan value | Often partly excluded from wages |
| Retirement match | Base x min(employee %, cap %) x match rate % | Employer contribution value | Often tax-deferred |
| Other taxable | Annual taxable perks, stipends, allowances, or payments | Full annual amount | Usually taxable wages |
| Other non-taxable | Annual reimbursements or non-taxable allowances | Full annual amount | Depends on plan rules |
| Schedule pattern | Common annual input | Cliff or front load | Calculator handling | Best planning use |
|---|---|---|---|---|
| Four-year equal RSU | 25% | May vest quarterly or monthly | Use 25% for a normal full year | Public-company annual comp |
| One-year cliff then monthly | 25% after cliff | First-year value may arrive at month 12 | Use expected current-year vesting % | Startup offer timing |
| Back-weighted grant | 10% to 40% | Later years vest more | Enter this year's vesting % only | Retention grant comparison |
| Front-loaded grant | 35% to 50% | Early years vest more | Enter the current-year percentage | Year-one package value |
| Performance equity | 0% to 200% factor | Depends on performance certification | Fold expected factor into vesting % | Executive or leadership plans |
| Option grant | 25% typical | Value depends on spread | Use intrinsic or expected value per unit | Private-company scenarios |
| Plan wording | Match rate input | Employee contribution input | Cap input | Example on 100,000 base |
|---|---|---|---|---|
| 50% match up to 6% | 50% | 6% | 6% | 3,000 employer match |
| 100% match up to 3% | 100% | 3% | 3% | 3,000 employer match |
| 100% up to 4%, then 50% next 2% | 83.3% | 6% | 6% | About 5,000 match |
| 25% match up to 8% | 25% | 8% | 8% | 2,000 employer match |
| Flat employer contribution 4% | 100% | 4% | 4% | 4,000 employer contribution |
| No employer match | 0% | Any | 0% | 0 employer match |
| Package type | Base signal | Variable signal | Equity signal | Benefits signal | Calculator focus |
|---|---|---|---|---|---|
| Cash-heavy salary | High | Low to moderate | None or small | Moderate | Compare guaranteed cash |
| Corporate bonus | Moderate to high | Bonus funded by score | Small refreshers | Strong | Stress test multiplier |
| Enterprise sales | Moderate | High commission | Small to none | Moderate | Use attainment and caps |
| Public tech RSU | High | Bonus or commission | Liquid annual RSUs | Strong | Track vesting year value |
| Startup equity | Moderate | Small bonus | Large uncertain grant | Lean to moderate | Adjust liquidity value |
| Benefits-rich role | Moderate | Low | None | High employer paid | Separate cash and benefits |
| Consulting plan | High | Project bonus | None or small | Moderate | Model taxable extras |
| Remote stipend mix | Moderate | Low to moderate | Small | Stipends and reimbursements | Split taxable and non-taxable |
If one offer looks better only after private-company equity is valued at 100%, rerun it with a 25% to 50% liquidity adjustment and compare the cash compensation card again.
For year-one decisions, enter the actual first-year vesting percentage. A four-year grant is not always 25% in year one if there is a cliff or back-weighted schedule.
Calculator reference prepared for JSCalc-Blog.com.
Your career isn’t just about your base salary; though that’s usually its anchor. It’s also about real compensation including cash, equity, benefits, and tax-advantaged retirement matches. The base salary is number that should be on the offer letter; real compensation are what you should think of as your total value. Plugging in your own personal mix into calculator lets you skip guessing how everything converts to dollars, and helps you treat the whole package as one financial unit instead of a group of different perk.
Here’s the thing: what gets counted is hard to figure out. You hear about salary (which most folks treats as “annual wage”). You don’t count variable pay (it seems squishy). And you don’t count equity or benefits. Equity has a confusing vesting schedule, but benefits looks like they are all standard. Yet standard benefits range from three-hundred to three-thousand dollars per year in health insurance premium payments alone. That ain’t no chump change and it won’t show up on your bank statement (so if you move jobs, you’ll never notice the difference).
How to Calculate Your Total Pay
But let’s begin with the base salary, which is known quantity. Then layer on expected bonus and adjust for realism. In particular, if bonuses has been paid at only 90% (e.g. “down” years) throughout your company’s history, plug 90% into this calculator. It will be tempting to plug in 100%, but don’t do so. You’ll be able to put that multiplier in right away. This helps you remove the optimism bias, that bias causes all offers to appear attractive.
If you’re in sales: Different story. You should of include caps and consider rate of attainment. Maybe your real rate is always 80%. Model that rather than the hypothetical maximum. The gap between what you might recieve hypothetically vs. What you’d accept home can be as large as twenty thousand dollars or more.
And then there’s equity. Equity is where the real confusion lives. Public RSUs are clear: You know your vesting schedule, you know the share price. Private company options are a shot in the dark. The calculator wants to know your liquidity adjustment (i.e., the sanity check most people ignore). If you own private stock, it isn’t liquid, and it could be worth nothing if the company doesn’t exit. Sliding this percentage downward to 50 or as low as 25 percent help you get a realistic sense of risk. What was once a flashy grant becomes a believable asset. You’re not being pessimistic; you’re being accurate.
Free money; remember the retirement match? If your company offers a 50% match on up to 6% of pay, then that’s a sure thing. It’s deferred and it’s taxed, but you get it on top of your total pay. The rest of the picture includes benefits and stipends. You also get tuition reimbursement. There is a commuting allowance. You also get a remote work stipend. Some are tax-free. Some aren’t. Helping you think through how they separate will help you think through taxes. A dollar without withholdings are worth more than one taxed (in the case of a nontaxable reimbursement). It also breaks out cash from equity. This shows your total package value in terms of what you actualy receive.
You have the taxable gross, which lets you make an apples-to-apples comparison between offers. Does a high-base/low-equity startup offer look weak? Or does a high-base/no-equity corporate job looks weak? It depends on what weight you give to the equity. Looking at the full price without accounting for risk makes the startup look strong. Adjustment for liquidity might make the corporate offer strong. You don’t care about getting the biggest number, you just want the package that meets your cash flow requirements and risk tolerance.
Run these numbers before you negotiate. Understand the tradeoffs. Understand what is in them. In most cases, higher base + lower bonus = better outcome (almost always). Liquid cash > Illiquid equity. But everything depends on context. The tool gives you the arithmetic; your job is to supply the judgment.
Base first. Build the rest around it. That way, instead of guessing, you’ll know.