Raise Percentage Calculator
Compare old pay and new pay across salary, hourly, monthly, biweekly, and bonus-inclusive compensation with inflation-adjusted real raise math.
Use compare mode when you know both amounts.
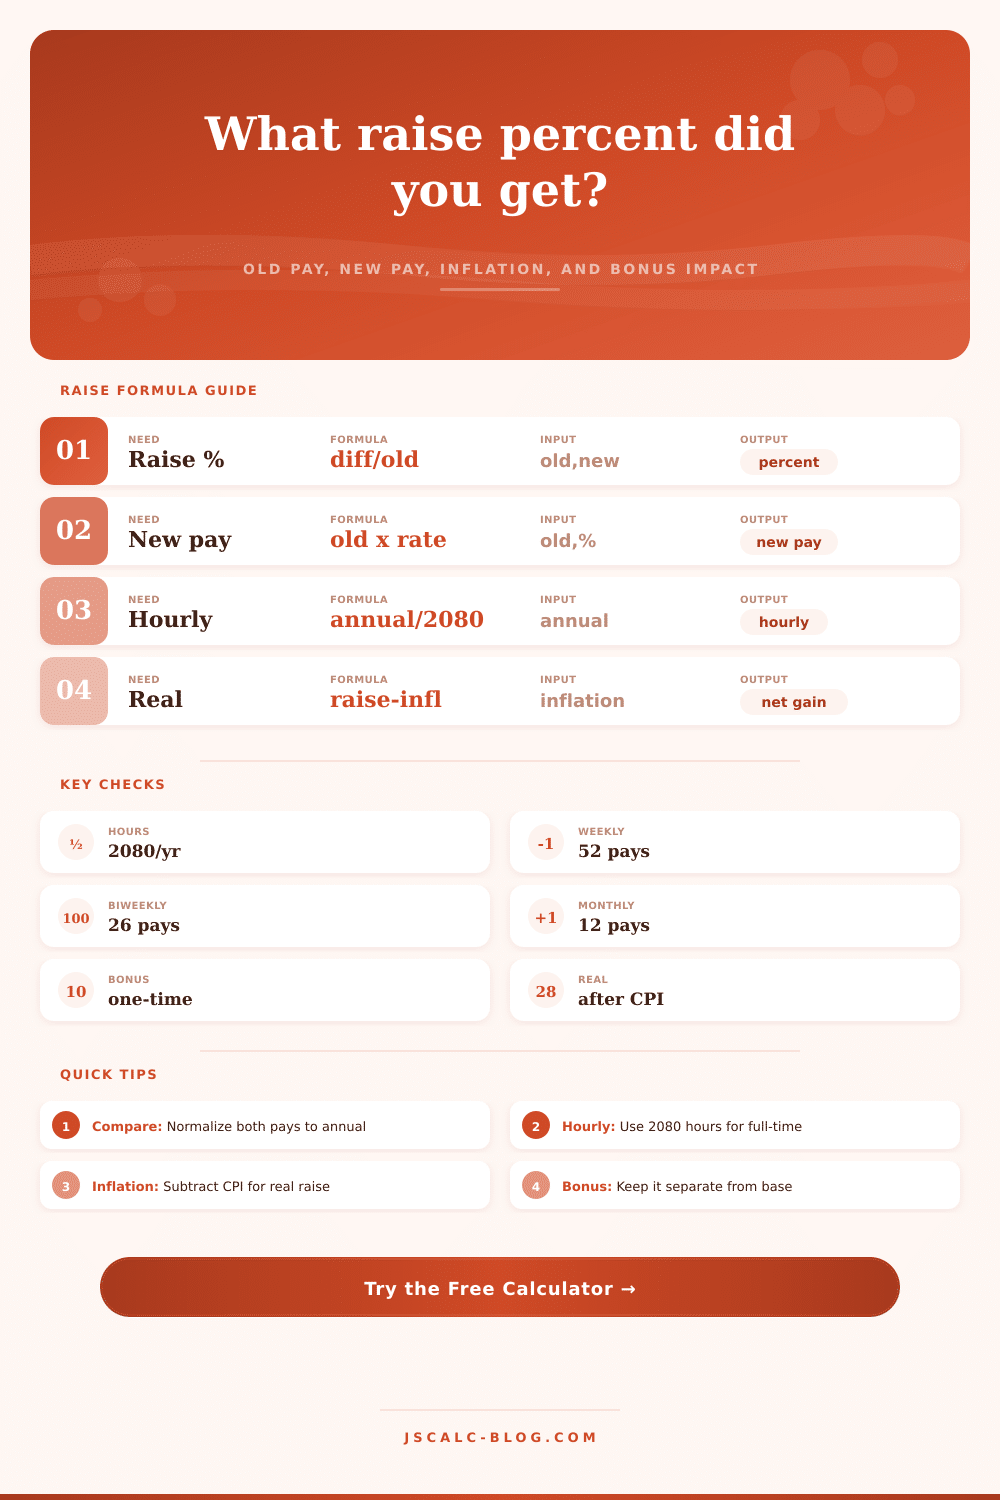
The calculator annualizes pay before comparing.
Enter old pay using the selected basis.
In target mode, this is recalculated from percent.
Used to calculate new pay when target mode is selected.
2080 hours is the standard 40 x 52 full-time year.
Shows the pay-period difference after the raise.
Real raise uses purchasing-power math.
Keep recurring salary and bonus visible.
Use expected annual bonus, not a one-time sign-on amount.
Optional rough take-home effect for the added pay.
Rounding affects displayed pay amounts only.
Raise results
| Frequency | Periods per year | Annual formula | Period formula | Best use |
|---|---|---|---|---|
| Annual salary | 1 | entered amount | annual / selected periods | Salary offers and merit letters |
| Monthly | 12 | monthly x 12 | annual / 12 | Monthly payroll countries or contracts |
| Semimonthly | 24 | semimonthly x 24 | annual / 24 | Twice-monthly payroll |
| Biweekly | 26 | biweekly x 26 | annual / 26 | Common US payroll schedules |
| Weekly | 52 | weekly x 52 | annual / 52 | Hourly wage and weekly salary jobs |
| Hourly full-time | 2080 hours | hourly x 2080 | annual / periods | 40-hour workweek comparisons |
| Old annual pay | Raise % | New annual pay | Annual increase | Biweekly increase | Hourly increase |
|---|---|---|---|---|---|
| $35,000 | 3% | $36,050 | $1,050 | $40.38 | $0.50 |
| $45,000 | 4% | $46,800 | $1,800 | $69.23 | $0.87 |
| $55,000 | 5% | $57,750 | $2,750 | $105.77 | $1.32 |
| $65,000 | 6% | $68,900 | $3,900 | $150.00 | $1.88 |
| $75,000 | 8% | $81,000 | $6,000 | $230.77 | $2.88 |
| $90,000 | 10% | $99,000 | $9,000 | $346.15 | $4.33 |
| $110,000 | 12% | $123,200 | $13,200 | $507.69 | $6.35 |
| $140,000 | 15% | $161,000 | $21,000 | $807.69 | $10.10 |
| Hourly rate | Annual at 2080 hours | 3% raise | 5% raise | 8% raise |
|---|---|---|---|---|
| $15.00 | $31,200 | $15.45 | $15.75 | $16.20 |
| $18.00 | $37,440 | $18.54 | $18.90 | $19.44 |
| $22.00 | $45,760 | $22.66 | $23.10 | $23.76 |
| $28.00 | $58,240 | $28.84 | $29.40 | $30.24 |
| $35.00 | $72,800 | $36.05 | $36.75 | $37.80 |
| $45.00 | $93,600 | $46.35 | $47.25 | $48.60 |
| Nominal raise | 2% inflation | 3% inflation | 4% inflation | 5% inflation |
|---|---|---|---|---|
| 2% | 0.00% | -0.97% | -1.92% | -2.86% |
| 3% | 0.98% | 0.00% | -0.96% | -1.90% |
| 4% | 1.96% | 0.97% | 0.00% | -0.95% |
| 5% | 2.94% | 1.94% | 0.96% | 0.00% |
| 7% | 4.90% | 3.88% | 2.88% | 1.90% |
| 10% | 7.84% | 6.80% | 5.77% | 4.76% |
Until you see how a raise percentage translates into your buying power, your bi-weekly budget, and your hourly rate, it’s nothing more than a label. What you see in black-and-white is higher-looking number, but underlying math is never as simple. Did you make any progress? Was it wiped out by inflation? When does inflation win, and when do you win?
Most of us gets stuck on headline number, and that’s when we go wrong.
Why You Should Check the Real Value of Your Raise
Once you enter your current pay and what you’re hoping to get paid, the calculator do all of the work for you. So you don’t have to try to remember to convert from hourly to monthly to annual. But understanding why those conversions matter is half battle.
If your employer offers you a certain percentage increase, it sounds great! But when you look at your total compensation, the story might be different. You may has lost some hours or your bonus could of changed. You should turn everything into an annual figure before comparing. A 5% bump up on base salary isn’t worth anything if you’ve had your variable pay cut by 10%. By allowing you to enter both your base salary and bonus individually, the tool will lay that all out for you, showing you exactly what difference really is.
And then there’s the hourly amount… Particularly useful if you’re switching jobs or simply want to see what your market value may be. By default, it assume an eight-hour day times five days a week equals forty hours a week. This totals 2,800 hours per year. But your work might not be that rigid. Maybe you frequently put in extra time and/or enjoy paid vacation days, which affects the hourly amount. The calculator allows you to tweak those annual hours, a small detail that often changes how the offer look. Not only is it the rate, but its the density of the work behind the rate.
Every paycheck is taxed by inflation. In a low-inflation year, four percent sounds like a decent raise. But in a high-cost year, that’s barely standing still. To see how much you’re realy raising your standard of living, the cost of living increase must be deducted from your nominal raise. That shows you what you can literal buy with the extra money.
When headline inflation is three percent and your raise is four percent, you haven’t gained one percent in purchasing power. In fact, you’ve gained less because the math compound. The calculator do the right thing here: it divides growth factors instead of just subtracting the percentages. This is a subtle difference, but it grounds your expectations.
The other place confusion sets in is with how often you get paid. If you switch from being paid monthly to being paid every two weeks, your annual income stay the same, but timing of your money changes. For some, getting paid more frequently makes them feel richer (even though their total amount of money stays the same).
So here’s a handy reference table on the page to help you convert between pay schedules and observe its effect, period by period. You’ll be able to see exactly how much money gets deposited into your bank account every month vs. This happens every two weeks.
Why does this matter? It matters for budgeting purposes. Having a handle on the amount that arrives every week will allow you to plan around recurring bill that don’t line up with your own payroll schedule.
Also keep in mind that your tax bracket can creep up on you over time. You may bump into a higher marginal rate as your income increases. There’s an estimated withholding field in the calculator, which will let you get a rough idea of what the take-home effect would be. It is not a tax return, but it is a useful sanity check. That additional thousand dollars doesn’t feel like a thousand dollars when the government takes there cut.
If you’re negotiating for a promotion or a merit increase, your best advantage is to understand your numbers. Knowing your numbers is half of the equation, and sitting down with the tool are the other half. What’s going to happen if they match the bonus but only offer four percent? What’s going to happen if they offer six percent but don’t include a bonus? Those aren’t always obvious answers until you put them side-by-side. This is how you’ll stress test various scenarios.
Raising your rate by a percentage point isn’t just a change in wording; it is a change to your basic financial standing. If you want to get the details correct, you’re not just raising your rates for a number’s sake; you’re truly making yourself better off. If you can learn how to ask the right questions, math will tell you what doesn’t lie.