Sum-of-Years-Digits Depreciation Calculator
Estimate accelerated SYD depreciation, partial-year timing, target-year expense, accumulated depreciation, and ending book value.
📌Scenario Presets
🧮Asset Inputs
Changing this can fill a typical useful life.
Used only when custom convention is selected.
SYD Depreciation Results
📊Key Metrics
📋Depreciation Schedule
| Year | Reporting Period | SYD Depreciation | Accumulated Depreciation | Ending Book Value | Depreciated Percent |
|---|
🔁Comparison Grid
| Scenario | Year 1 Expense | Target Year Expense | Accumulated Through Target | Book Value After Target | Front-Load Signal |
|---|
📘SYD Formula Breakdown
| Step | Formula | Meaning | Calculator Use |
|---|---|---|---|
| Depreciable base | Cost - salvage | Maximum amount that can be depreciated. | Reduced by depreciable-use percentage when entered. |
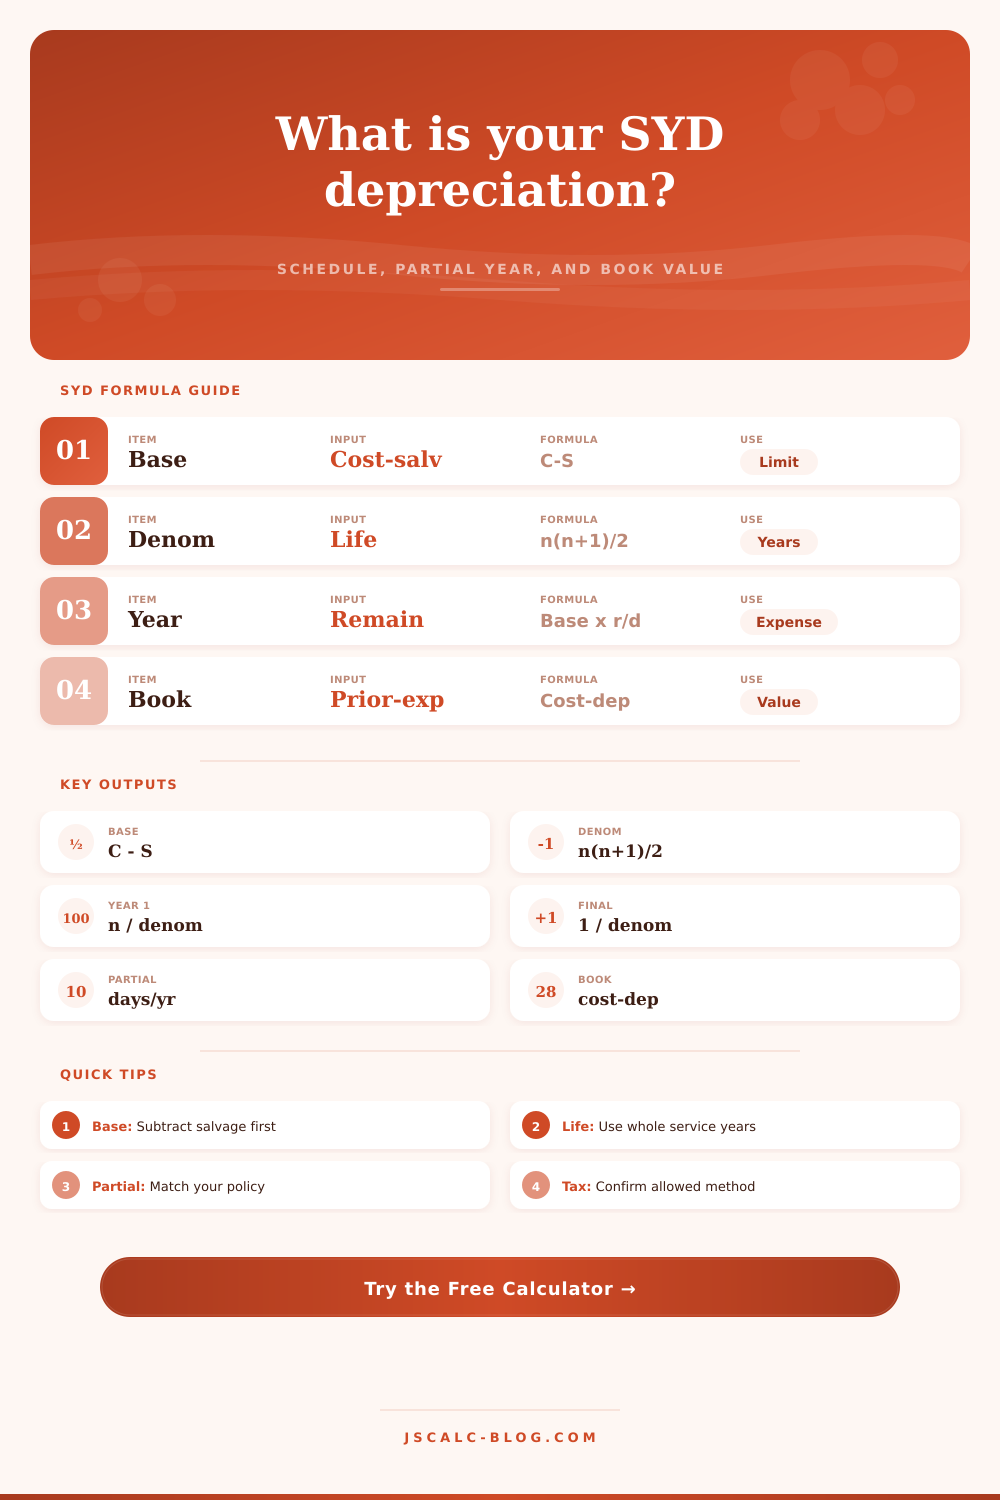
| SYD denominator | n(n+1)/2 | Sum of the useful-life year digits. | 5 years gives 15; 7 years gives 28. |
| Full service-year expense | Base × remaining life / SYD | Earlier years get larger fractions. | Year 1 uses n/SYD; final year uses 1/SYD. |
| Partial reporting year | Prior charge × unused fraction + current charge × first fraction | Blends two service-year charges when the asset starts mid-year. | Creates n+1 reporting rows when first fraction is below 100%. |
🗂Useful Life Reference
📑Convention Reference Table
| Convention | First-Year Fraction | Schedule Length | Best Fit |
|---|---|---|---|
| Full-year | 100% | n years | Internal books when policy allows a full first year. |
| Half-year | 50% | n + 1 years | Simple planning convention for mid-year purchases. |
| Mid-quarter | 87.5%, 62.5%, 37.5%, or 12.5% | n + 1 years | Quarter-based timing when purchases cluster late. |
| Actual months | Months in service / 12 | n + 1 years unless 12 months | Monthly management reporting. |
| Actual days | Days in first fiscal year / days in fiscal year | n + 1 years unless full year | Daily proration for precise book schedules. |
| Custom | Your entered percentage | Depends on fraction | Matching an accounting policy or imported schedule. |
🔢Common SYD Fractions
| Useful Life | Denominator | Year 1 Fraction | Middle-Year Example | Final-Year Fraction |
|---|---|---|---|---|
| 3 years | 6 | 3/6 = 50.00% | 2/6 = 33.33% | 1/6 = 16.67% |
| 4 years | 10 | 4/10 = 40.00% | 2/10 = 20.00% | 1/10 = 10.00% |
| 5 years | 15 | 5/15 = 33.33% | 3/15 = 20.00% | 1/15 = 6.67% |
| 7 years | 28 | 7/28 = 25.00% | 4/28 = 14.29% | 1/28 = 3.57% |
| 10 years | 55 | 10/55 = 18.18% | 5/55 = 9.09% | 1/55 = 1.82% |
| 15 years | 120 | 15/120 = 12.50% | 8/120 = 6.67% | 1/120 = 0.83% |
💡Practical Tips
The asset is a big-ticket item. You purchase it because it do the most work during Year One. It wears out components; it guzzles gas; it produces maximum income from day one. And then… what? Then it sits in a corner while you try to squeeze out every last dollar of value. Straight-line depreciation treats this fact as nonexistent. On paper, it’s evenhanded: it allocates the same amount each year, no matter the true wear-and-tear.
Sum-of-years-digits address that gap by front-loading the cost, to reflect asset’s performance more accuratley. Your books match up better with the way the asset operate in real life.
How to Use the Sum-of-Years-Digits Method
This is a simple fraction; with an annual adjustment. Divide the remaining useful life of the asset into total number of years in its life. (In other words, if the machine has a five-year life, then add 5 + 4 + 3 + 2 + 1 = 15.) That’s your denominator. You’ll claim five fifteenths of the depreciable base in year one. Then you’ll claim four fifteenths of the depreciable base in year two. And so on. The slice get smaller over time as the asset ages.
This not only puts the tax shield upfront at the moment your cash flow might most require it, but it prevents book value from being artificially high while the asset is declining in value the fastest.
After plugging in your individualized parameters, the calculator runs the numbers and spares you the struggle of wrestling with odd partial-year conventions yourself.
Nobody buys an asset on January 1st. Most assets are not bought on January 1st because they arrive mid-year, often after a long installation or a delayed shipment. That screws up clean fractionation we’ve been building toward all this time. You end up having to divide the first year into two fractions: one representing full year, and the other representing the portion during which you actualy used the asset. The tool handles this by applying whatever convention you select. For simplicity, choose half-year; for accuracy, choose actual days. Your answer won’t change. The total amount you’ll ultimately depreciate remains the same, though your starting and ending reporting periods will shift slightly.
The other thing that throws people off is salvage value. Before plugging those fractions into the equation, you need to reduce purchase price by estimated resale amount. That’s your depreciable base. And if you fail to account for the salvage figure, you’ll be overstating your expense; while also underestimating the asset’s balance-sheet value. It’s a minor tweak to input variables, but it alters all the numbers downstream. The tool makes you consider the leftover value at the start. It keeps you from writing down an asset until it has no remaining value to someone else who might buy it used or sell it for scrap.
Here’s another thing: Book accounting rules don’t necessarily correspond with tax rules. In many jurisdictions, tax returns are done using simpler-to-audit straight-line or declining-balance methods. For internal management reporting (or in countries where accelerated book methods is allowed), a company may use sum-of-years-digits. The calculator has a comparison grid that highlights SYD’s performance next to straight-line or double-declining-balance. It allows you to see the front-load signal easy. You can tell at a glance how much more expense you’re claiming in year one as compared to later years. That difference is the benefit of your tax shield in the short run.
Life estimates vary wildly by industry. A delivery van might last five years before maintenance costs skyrocket. Others have really long ones (15+ years on a big production press). The tool’s reference tables includes some common benchmarks. This keeps you from pulling out of thin air a number that just *feels* right but has no historical basis. If you use a too-short life, you’ll bloat your expenses and hurt your reported profits. If you use a too-long one, you’ll mask the real cost of doing business. Both distort your financial picture. The trick is to pick a life that’s defensible and consistently applied.
Examine the last page and run your eyes down the book value column. Ideally it will descend gently toward your salvage value without ever dipping below it. If so, then you’ve entered something incorrecly. These gaps are flagged by the tool. Better to identify a mistake on setup day than upon audit day.
As an accountant’s estimate, depreciation isn’t an exact science; it’s a matter of judgment. Sum-of-years-digits provides some structure for that judgement while matching the physics of how your assets ages. Get the expense when the asset earns it. Get the value when the asset retains it. It should of been a cleaner way to tell the story of your capital investment.