Declining Balance Depreciation Calculator
Calculate declining balance depreciation from beginning book value, useful life, acceleration factor, salvage value, service timing, and an optional straight-line switch. The schedule shows yearly expense, accumulated depreciation, closing book value, and the first year where straight line becomes the better expense.
🎯Asset Presets
🧮Depreciation Inputs
Used for display only; keep every money input in the same currency.
Feeds the benchmark cards and interpretation, not a tax rule.
Purchase price plus capitalized freight, installation, and setup.
Book value never drops below this floor.
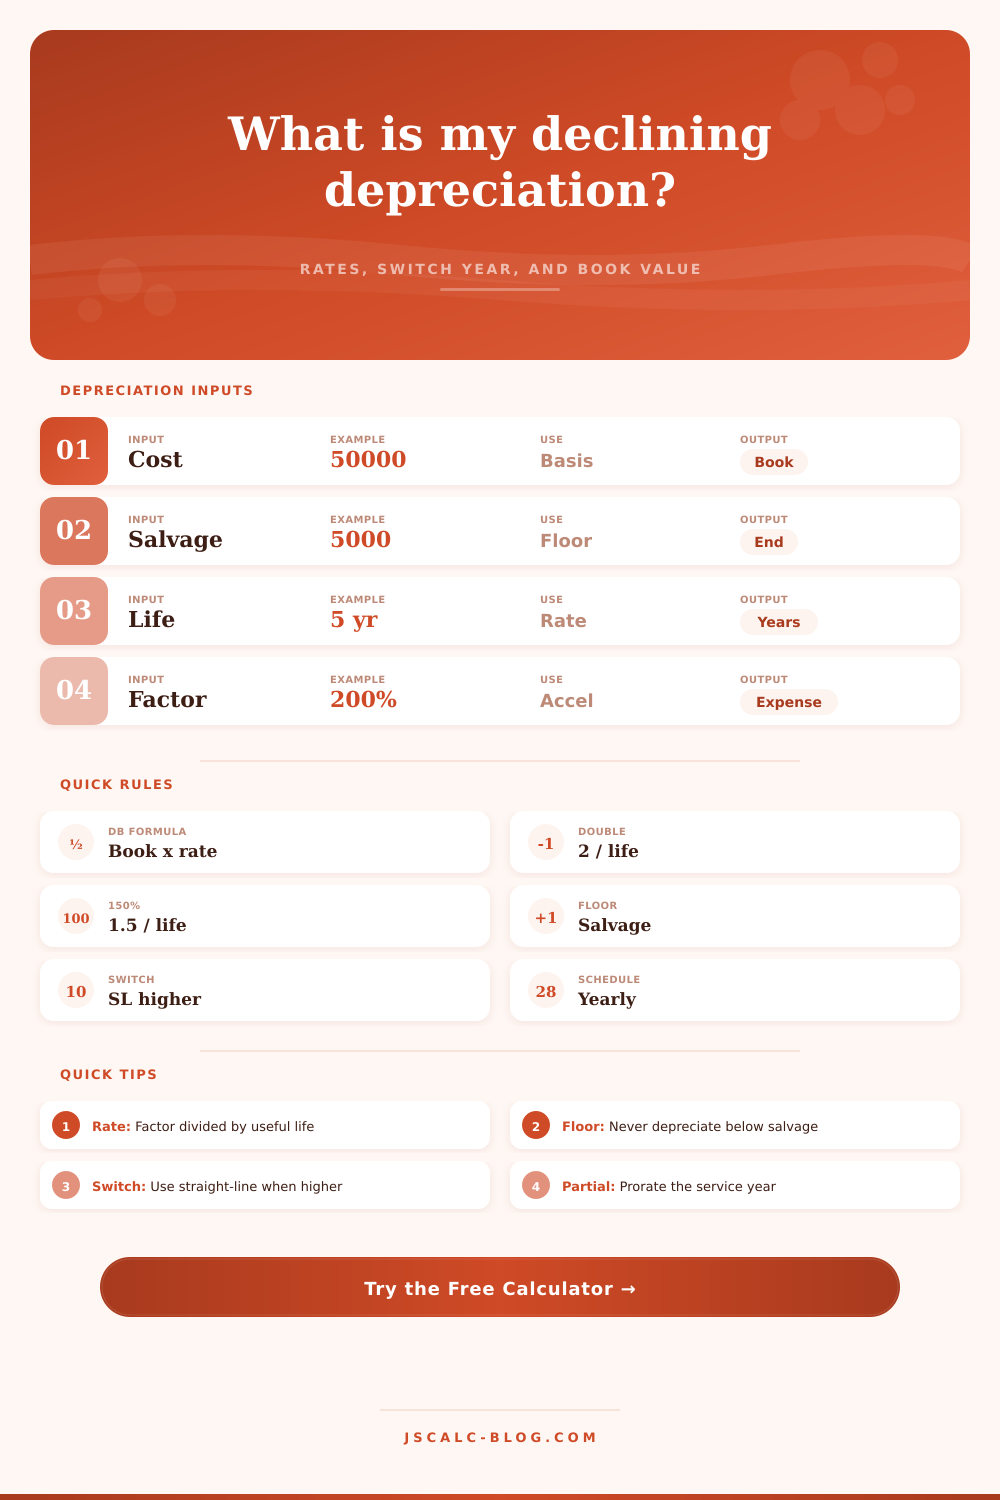
Double declining balance rate equals 2 divided by useful life.
Choose a factor-based method or enter a direct annual rate.
200% gives double declining balance; 150% gives 1.5 divided by life.
Used only when method is custom depreciation rate.
The switch prevents tiny final-year remnants and mirrors common schedules.
Proration changes timing but still respects the salvage floor.
Used when first-year convention is prorated by month.
Labels the schedule rows without changing the math.
Card four reports closing book value at this year.
Cents are kept internally; this changes display precision only.
🔢Method Snapshot
📊Year-by-Year Schedule
| Year | Label | Beginning Book | Method Used | Depreciation | Accumulated | Ending Book |
|---|---|---|---|---|---|---|
| Enter values above to build the declining balance depreciation schedule. | ||||||
🔁Method Comparison Grid
| Scenario | Year 1 Expense | Switch Year | Years to Floor | Total Depreciation | Book at Highlight |
|---|---|---|---|---|---|
| Comparison rows update after calculation. | |||||
📈Declining Balance Rate Reference
| Useful Life | Straight-Line Rate | 150% DB Rate | Double Declining Rate | First-Year Expense Per $10k Book |
|---|---|---|---|---|
| 3 years | 33.33% | 50.00% | 66.67% | $6,667 at 200% |
| 4 years | 25.00% | 37.50% | 50.00% | $5,000 at 200% |
| 5 years | 20.00% | 30.00% | 40.00% | $4,000 at 200% |
| 7 years | 14.29% | 21.43% | 28.57% | $2,857 at 200% |
| 10 years | 10.00% | 15.00% | 20.00% | $2,000 at 200% |
| 15 years | 6.67% | 10.00% | 13.33% | $1,333 at 200% |
| 20 years | 5.00% | 7.50% | 10.00% | $1,000 at 200% |
🗂Asset Benchmark Table
| Asset Type | Common Life Range | Common Factor | Salvage Pattern | Depreciation Shape |
|---|---|---|---|---|
| Computers and laptops | 3 to 5 years | 200% | Low to modest | Very front-loaded |
| Delivery vehicles | 5 years | 200% | Meaningful resale value | Front-loaded |
| Office furniture | 7 years | 150% to 200% | Moderate resale value | Moderate decline |
| Production machinery | 7 to 10 years | 150% | Scrap or trade-in value | Moderate decline |
| Restaurant equipment | 5 to 7 years | 150% to 200% | Used-market value varies | Front-loaded |
| Medical equipment | 5 to 10 years | 150% | Regulated resale market | Moderate decline |
| Tooling and dies | 3 to 7 years | 200% | Often low salvage | Heavy early expense |
| Warehouse equipment | 7 years | 150% to 200% | Trade-in value common | Front-loaded |
⚙Formula Breakdown
📋Straight-Line Switch Reference
| Switch Setting | Annual Test | Effect on Schedule | Common Use |
|---|---|---|---|
| Switch enabled | Use max(DB, SL on remaining base) | Usually reaches salvage exactly by the planned life | Management schedules and book models |
| Switch disabled | Use DB until capped by salvage | May leave a small amount until the final cap year | Pure declining balance sensitivity |
| Full first year | Year one fraction is 100% | Largest first-year expense | Simple model timing |
| Half-year convention | Year one fraction is 50% | Adds a partial catch-up row | Mid-year timing approximation |
| Monthly proration | Year one fraction is service months / 12 | Timing depends on placed-in-service month | Internal book schedules |
💡Practical Depreciation Tips
If you’re a business owner, you already understand that purchasing a delivery van or piece of heavy equipment are just the beginning of the financial story. How do you track the decline in value of this asset? And how does this decline reduces your tax bill?
Straight-line depreciation seems like an easy bet, after all, it’s simple and it seems safe. But straight-line tends to overlook how an asset depreciate. Your brand-new computer doesn’t lose half of its value at the 5th anniversary; instead, most computers devalue significant during their initial 18 months. By contrast, declining balance depreciation reflect the truth: It front-loads your costs while the asset remain most useful.
How Declining Balance Depreciation Works
It’s simple math. Rather than taking a flat slice out of its cost in each year, you calculate your depreciation as a percentage of whatever is leftover. This is why it’s sometimes known as double declining balance depreciation. The percentage you use are typically twice the straight-line rate. For example, if an asset has a five-year life, then the straight-line rate would of be twenty percent. Double that, and you’ve got a forty percent depreciation. Year one, you take forty percent off total cost. Then, year two, you take forty percent off the remainder. Because the base is shrinking, your expense decline over time, yet the early hits are much bigger.
Those big early deductions help cash flow, since they’ll lower your taxable income while you’re still paying down loans or dealing with any initial operating losses. Don’t worry about running all this math in your head. Just use the calculator (above) and it will do all the math for you, allowing you to see gradual loss of book value year after year. And it will handle the “salvage floor“, a key guardrail that too many people overlook. You can’t depreciate an asset down to less than what you think you’ll be able to get for it. Without this check, if you continue to apply the forty percent rate, you could accidently deplete the book value entirely or even drive it into the red!
The calculator will shut off the depreciation at the moment the book value reach the salvage limit, ensuring that your schedule conforms to accounting standards. Finally, there is the planning part of the straight-line switch. And this is where the calculator comes into its own. Because the percentage of a small number remain small, pure declining balance can result in small pieces of value that remains stranded on your books. The tool compares the declining balance expense to what a straight-line would have been on the remainder each year and switches at the point when straight-line becomes preferrable. That typically occurs in the last couple of years of an asset’s useful life. That way, you pull out all the dollars of allowable depreciation prior to the end of the asset’s useful life. It is a small tweak, but one that keeps from leaving money on the table.
The other factor is timing. You can’t purchase an asset in October and expect to depreciate it at the full year’s rate for that calendar year. The inputs will divide up your first year so that it match up with the date the asset went into service. This way, your own books matches the tax conventions (e.g., the half-year rule/mid-quarter rule, whatever they call it where you live), and you don’t over-depreciate in year one while fixing it later.
This knowledge of the inputs lets you model various scenarios. Can speeding up the depreciation increase the net present value? Would it be better to spread the cost evenly over time? This lets you match expenses with the benefit provided by the asset. Most of the expense happens when the machine runs most efficiently and produces the highest revenue. This is what people fail to appreciate when they fall back on the easiest answer (straight-line depreciation).
Included with the tool are some reference tables that set out the factors and useful lives for various types of assets. For example, a vehicle tends to be good for five years; computers range from three to five year. This helps you see where your asset is on this list, which will help guide your inputs. It removes the guessing on what to use for the acceleration factor and useful life.
Ultimately, this comes down to both time and money. No matter which depreciation method you select, you’ll always be deprecating the cost less salvage value. The variable is the timing of that deduction. A declining balance approach allow you to hold onto more cash in your pocket earlier in the life of the investment. It’s a simple tool, but it can have a big impact on your bottom line if used correctly. Let the math do the heavy lifting and focus on the strategic decisions.