Straight Line Depreciation Calculator
Spread an asset's cost evenly across its useful life. Find annual depreciation expense, the depreciation rate, the depreciable base, running book value, and a full year-by-year schedule with optional partial first-year proration.
📌Real Asset Presets
📝Asset Inputs
Purchase price plus setup, freight, and install costs.
Estimated resale value at the end of useful life.
Used only when convention is prorate by month.
Book value at the end of this year is shown in card four.
🔢Formula Snapshot
📊Year-by-Year Schedule
| Year | Label | Depreciation | Accumulated | Book Value |
|---|---|---|---|---|
| Enter values above to build the depreciation schedule. | ||||
📈Depreciation Rate Reference
| Useful Life | Rate 1/Life | Per $10k Base | Typical Assets |
|---|---|---|---|
| 3 years | 33.33% | $3,333 | Software, laptops, phones |
| 5 years | 20.00% | $2,000 | Vehicles, computers, tools |
| 7 years | 14.29% | $1,429 | Office furniture, fixtures |
| 10 years | 10.00% | $1,000 | Machinery, equipment |
| 15 years | 6.67% | $667 | Land improvements, fences |
| 27.5 years | 3.64% | $364 | Residential rental property |
| 39 years | 2.56% | $256 | Commercial buildings |
🏷Salvage Value Examples
| Cost | Salvage % | Salvage $ | Depreciable Base | 5-Year Annual |
|---|---|---|---|---|
| $10,000 | 0% | $0 | $10,000 | $2,000 |
| $10,000 | 10% | $1,000 | $9,000 | $1,800 |
| $10,000 | 20% | $2,000 | $8,000 | $1,600 |
| $30,000 | 15% | $4,500 | $25,500 | $5,100 |
| $50,000 | 10% | $5,000 | $45,000 | $9,000 |
| $80,000 | 5% | $4,000 | $76,000 | $15,200 |
🗂Method Comparison Grid
| Method | Year 1 Weighting | Expense Pattern | Best For | Complexity |
|---|---|---|---|---|
| Straight line | Equal share | Flat each year | Steady-use assets | Simplest |
| Declining balance | Heaviest | Front-loaded | Fast-obsolete tech | Moderate |
| Double declining | Very heavy | Steep front load | Aggressive write-off | Moderate |
| Sum-of-years digits | Heavy | Declining slope | Early-heavy usage | Higher |
| Units of production | Usage based | Varies by output | Meter or mileage assets | Higher |
| MACRS half-year | Half share | Table driven | US tax filings | Highest |
⚙Full Formula Breakdown
📋Useful Life Reference by Asset
| Asset Type | Common Life | Rate | Salvage Note |
|---|---|---|---|
| Smartphones and tablets | 2 to 3 years | 33% to 50% | Often little to no salvage |
| Laptops and computers | 3 to 5 years | 20% to 33% | Small resale value |
| Office furniture | 7 years | 14.29% | Modest salvage estimate |
| Light trucks and cars | 5 years | 20.00% | Meaningful resale value |
| Manufacturing machinery | 10 years | 10.00% | Scrap or trade-in value |
| Residential rental | 27.5 years | 3.64% | Land is not depreciated |
| Commercial building | 39 years | 2.56% | Structure only, not land |
💡Practical Depreciation Tips
Think about buying a delivery van. You buy a used delivery van for thirty thousand dollars because it is reliable and ready to work. But it’s not going to remain worth $30,000 indefinitely. Over time, the engine get less efficient, tires need replacing, and sunlight will fade its paint job.
Accounting require some mechanism for tracking this decline in value relative to revenue generated by vehicle. This is where depreciation comes in. Depreciation distribute the cost of an asset throughout the number of years it help you make money. The simplest form of this calculation are called straight line method. It treats the asset as if it declines in value at a steady rate, like a clock ticking away.
How to Calculate Straight Line Depreciation
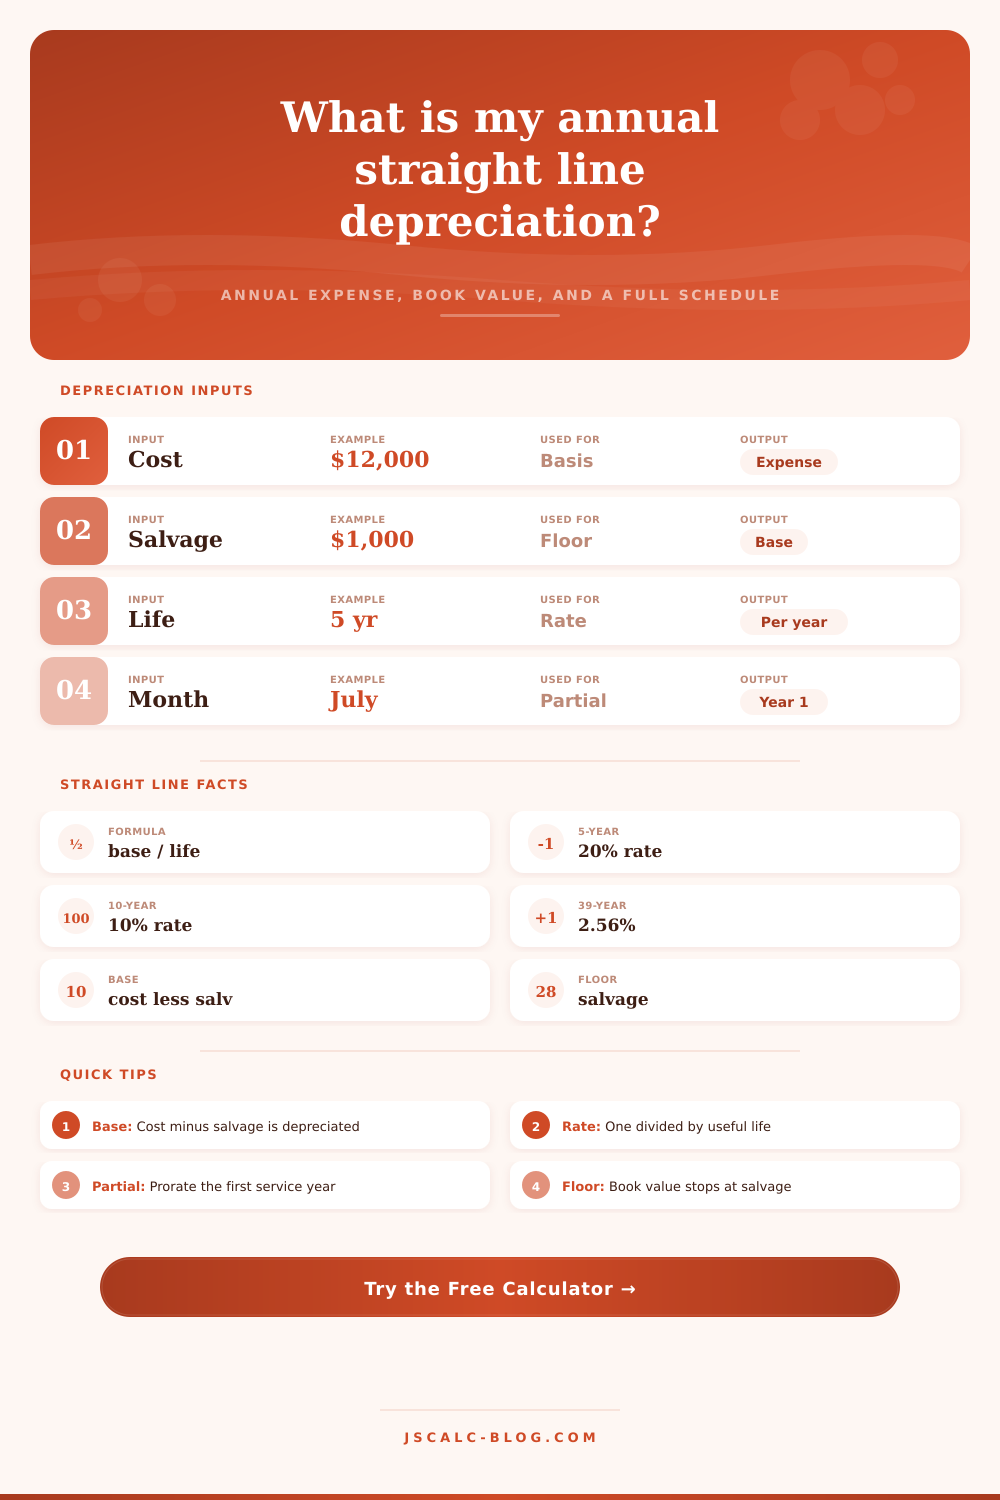
To get started with the math, we begin with a number known as your depreciable base. It’s not just the amount you paid for it. No no. First, you subtract salvage value. Salvage value is the amount that you believe you’ll be able to sell the item for after it stop serving you. For instance, if you purchase the van for thirty thousand and plan to turn around and trade-in for three thousand, then you’re going to be depreciating twenty-seven thousand dollars.
Twenty-seven grand is the true cost of owning the car. Plug those numbers into the calculator above (it does the math for you) and you save yourself having to guess what the remaining residual value is after it stops doing work for you. Then you divide it by its useful life. That’s an estimate of how many years the asset will remain useful for your particular business need. (It could differ from its tax life, which is fine.) This is about economics, not the law.
If you give a five-year estimate, you write off 20 percent of base per year. Ten years? That brings it down to ten percent. One divided by whatever number of years, that’s the rate. Every quarter, that rate determine your cash flow. It seems random until you understand that. The second is that time actualy plays an even bigger role than expected.
Very few businesses purchase an asset on Jan 1st. Why would they? What if you purchased the van and got it on the road in July? You only operated it for half the year. Prorate the cost for the first year. Choose the correct convention when using the tool, and it will automatically account for partial years. Your initial tax return will show a lower deduction, and then the last year will show a slightly higher one to make up the difference. But overall, it doesn’t change anything. It simply shifts the timing of when you recognize it in your books.
Another thing that trips people up is book value. This is nothing more than price you originally paid less every bit of depreciation you’ve recorded to date. Every single year, it decrease until it reaches the salvage value floor. From then on out, you don’t depreciate any further…unless something goes wrong and there’s some type of physical damage or loss. You use it to track what the actual value of the asset is on your balance sheet today (not what you paid for it five years ago).
That’s where judgment enters into choosing the right useful life. For example, a laptop could have a ten-year mechanical lifespan, but will be obsolete within three years. Your shorter time period should correspond with its actual usefulness. Maybe heavy machinery might run for fifteen years but lose most of its efficiency after seven. The table of references on the page provides a guide for this across typical types of assets.
Don’t pull an arbitrary number off the wall because “it sounds good”. Pull a number consistent with how much you actualy use the equipment. Straight line is predictable. You know what to expect, straight line depreciation. No surprises there. Your profit margin looks steady from year to year, as all the expense is smoothed out.
You don’t have to worry about complicated front-loaded deductions to drive up your cash flow in the first few years, but you also don’t have any extra balls to juggle. Straight Line turns a complex world of aging machinery into an orderly schedule. Enter the cost, the salvage estimate and the number of years. There it is!