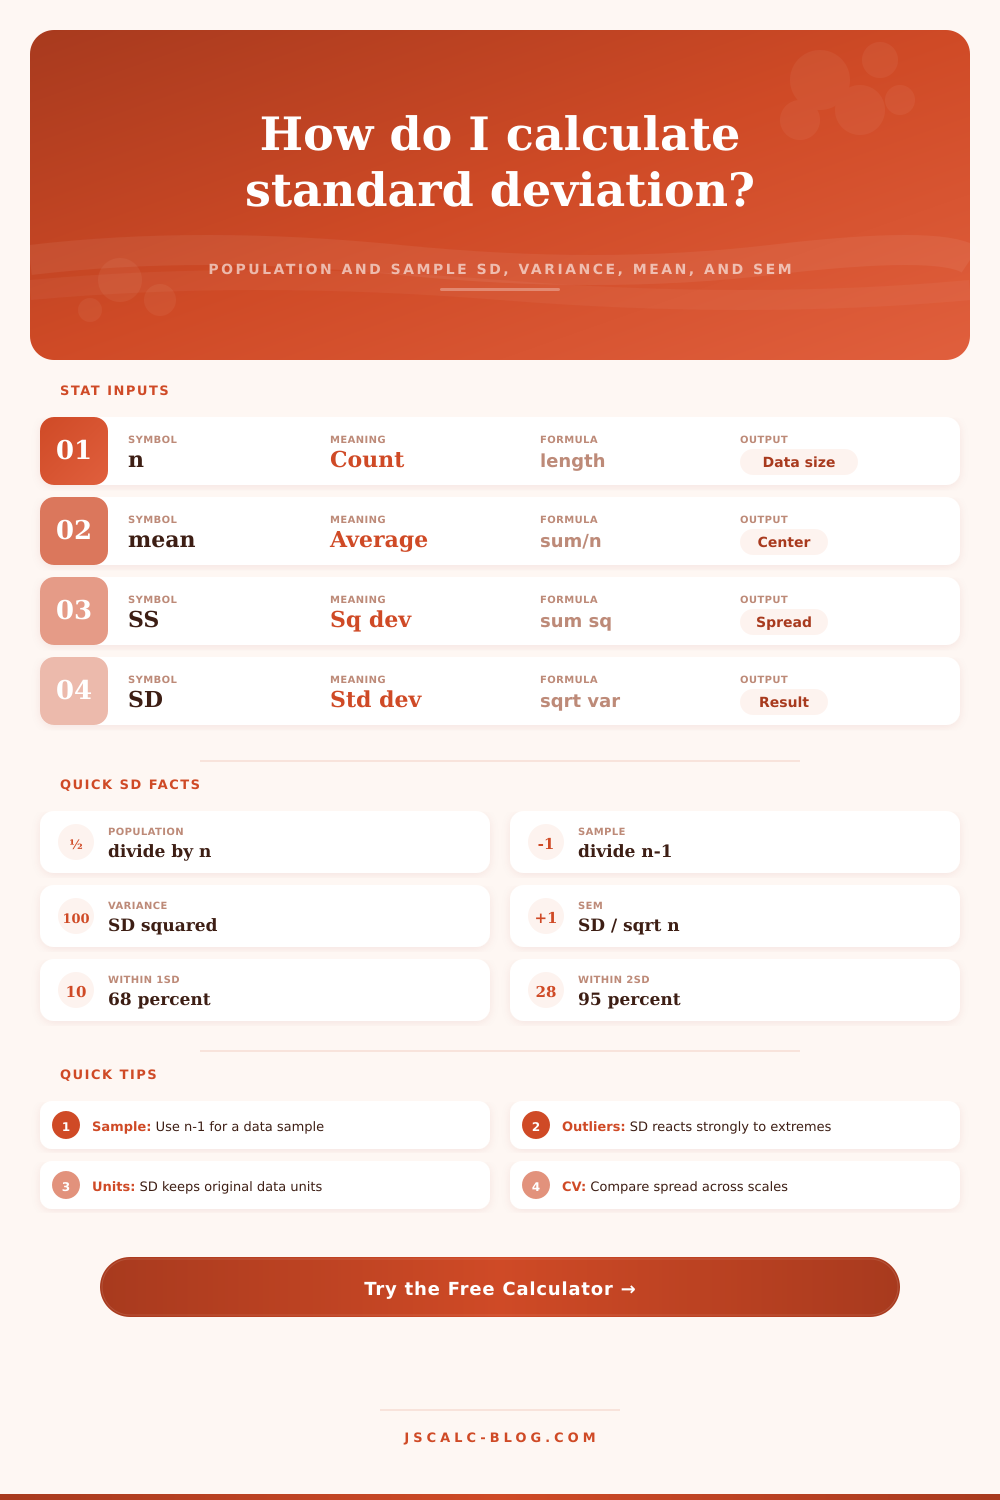
Standard Deviation Calculator
Paste any data set to get population and sample standard deviation, variance, mean, median, mode, range, standard error, coefficient of variation, a per-value deviation table, and the empirical 68-95-99.7 rule.
📌Real Data Presets
📝Data Set & Options
Paste as many numbers as you like. Decimals and negatives are supported.
🔢Formula Symbols
📊Per-Value Deviation Table
| # | Value (x) | x − mean | (x − mean)² |
|---|---|---|---|
| Enter values above to build the deviation table. | |||
Each squared deviation is added to get the sum of squares (SS).
📐Descriptive Statistics Summary
| Statistic | Value | Statistic | Value |
|---|---|---|---|
| The full summary appears after calculation. | |||
🎯Empirical Rule (68-95-99.7)
| Band | Range (mean ± k·SD) | Lower | Upper | Approx Inside |
|---|---|---|---|---|
| The empirical rule ranges appear after calculation. | ||||
The empirical rule assumes a roughly bell-shaped (normal) distribution. Skewed data may not follow these percentages.
🧮Population vs Sample Reference
| Quantity | Population Formula | Sample Formula | This Data (Pop) | This Data (Sample) |
|---|---|---|---|---|
| Population and sample results appear after calculation. | ||||
🗂Spread Measure Comparison
| Measure | What It Shows | Divisor | Units | Outlier Sensitivity | Best Use |
|---|---|---|---|---|---|
| Range | Max minus min | None | Same as data | Very high | Quick spread check |
| Variance | Average squared spread | n or n − 1 | Data squared | High | Math and modeling |
| Population SD | Spread of whole group | n | Same as data | High | Full known data set |
| Sample SD | Estimated group spread | n − 1 | Same as data | High | Sample of a group |
| SEM | Precision of the mean | SD / √n | Same as data | Medium | Error bars on mean |
| Coeff. of variation | Spread relative to mean | SD / mean | Percent | Medium | Compare across scales |
| IQR (context) | Middle 50% spread | Quartiles | Same as data | Low | Skewed data |
⚙Full Formula Breakdown
📋Choosing the Right SD Type
| Situation | Use This | Divisor | Why |
|---|---|---|---|
| You measured every member | Population SD | n | Nothing is being estimated |
| Survey or lab sample | Sample SD | n − 1 | Corrects bias toward zero |
| Class or census data | Population SD | n | The group is complete |
| Quality control batch | Sample SD | n − 1 | Batch represents production |
| Comparing two scales | Coeff. of variation | SD / mean | Removes the unit effect |
💡Practical Statistics Tips
A measure of standard deviation can be quite helpful when analyzing data. If you went to school, then perhaps you recall learning about standard deviation, that annoying equation with its squaring and square-rooting and everything. That’s where our calculator comes in: It does all that for you. It takes your numbers and turns them into useful measures (standard error, variance, etc.). No need for you to crunch those digits yourself. Just know what measure will help you best.
The decision of whether to calculate based off samples or the whole population. This alters equation. If you’re measuring everything in a set, then use the population formula. Divide by number of items measured. No information was lost, so don’t account for any. But if you measured just a portion, use the sample formula. Divide by one less than the number counted. That’s the way to correct for the fact that a small group will likely understate true variation, thereby creating a safety margin in math.
What Is Standard Deviation?
The spread tell you how far off the average you are by squaring those deviations. Otherwise, you’d just add up how far away from the average each piece of data was. That wouldn’t work because the positives and negatives cancel one another out. So you square it, which makes everything positive. The more dispersed your data, the bigger this number will be. Finally, you take the square root, which puts the number back into a form that makes sense again. Say you have data measured in centimeters. The answer will also be in centimeters. It gives you the right scale without having cancellation issue.
Standard deviation is greatly influenced by outliers. Deviations are squared, making extreme values more important. A couple of big/small numbers can increase/decrease this value. It’s good for figuring out where there might be risk/error with your data. But if you have skewed data, it could hide the typical case from view. Consider also looking at median along with the mean, that’ll give you a fuller picture of what’s going on.
The tool provides other metrics in context. Variance is just standard deviation squared. It is harder to see, but useful for modeling. The standard error of the mean show how precise your average is likely to be. If you have a low standard error, your sample mean is probably good at estimating population mean. Also offered is the empirical rule, which estimates how many data points will fall within one or two standard deviations from center. It is not a strict law, but more of a guideline for messy real-world data.
But which metric to choose? That depends on what you want to know. If you compare apples to houses, just standard deviation will mislead you. Apples and houses are in very different ranges of values. Coefficient of variation solves that problem. It’s simply spread expressed as a percent of the mean. So you can directly compare, regardless of units.
A lot of folks skip this tweak at the beginning of their analysis. But that’s only part of it. You’ve got to understand what the number means. A narrow distribution is clustered around the mean. That’s consistent. Is it a broad one? That’s uncertain. That’s volatile. No, you won’t have to remember all these formulas. What matters most is understanding what the results mean. The math tell you when things become stable and when they get crazy.