Standard Deviation Curve Calculator
Convert a raw score into z-score, normal percentile, z-band grade, and a normalized curved score using class mean, standard deviation, target mean, and target standard deviation.
Raw score before the standard deviation curve.
The calculator caps normalized scores at this maximum.
Use the average from the same assignment group.
Use the standard deviation for the raw score set.
Normalize method centers results on this mean.
Normalize method spreads scores by this amount.
Choose z bands for letters or normalize for a curved score.
Rounding affects display only, not the formula.
At or above this z is an A.
At or above this z is a B.
At or above this z is a C.
Below this z is an F.
| Z range | Approx percentile | Typical band | If mean 70, SD 10 | Use case |
|---|---|---|---|---|
| +1.50 and up | 93rd+ | A+ | 85+ | exceptional high tail |
| +1.00 to +1.49 | 84th-93rd | A | 80 to 84.9 | one SD above mean |
| +0.25 to +0.99 | 60th-84th | B | 72.5 to 79.9 | above-average range |
| -0.75 to +0.24 | 23rd-60th | C | 62.5 to 72.4 | central distribution |
| -1.50 to -0.76 | 7th-22nd | D | 55 to 62.4 | below-average range |
| below -1.50 | under 7th | F | below 55 | low tail |
| Raw score | Class mean / SD | Z-score | Target mean / SD | Normalized score |
|---|---|---|---|---|
| 86 | 74 / 10 | +1.20 | 80 / 10 | 92.0 |
| 61 | 52 / 12 | +0.75 | 75 / 9 | 81.8 |
| 73 | 72 / 8 | +0.13 | 78 / 8 | 79.0 |
| 51 | 62 / 11 | -1.00 | 72 / 10 | 62.0 |
| 45 | 50 / 15 | -0.33 | 70 / 12 | 66.0 |
| 94 | 82 / 6 | +2.00 | 85 / 7 | 99.0 |
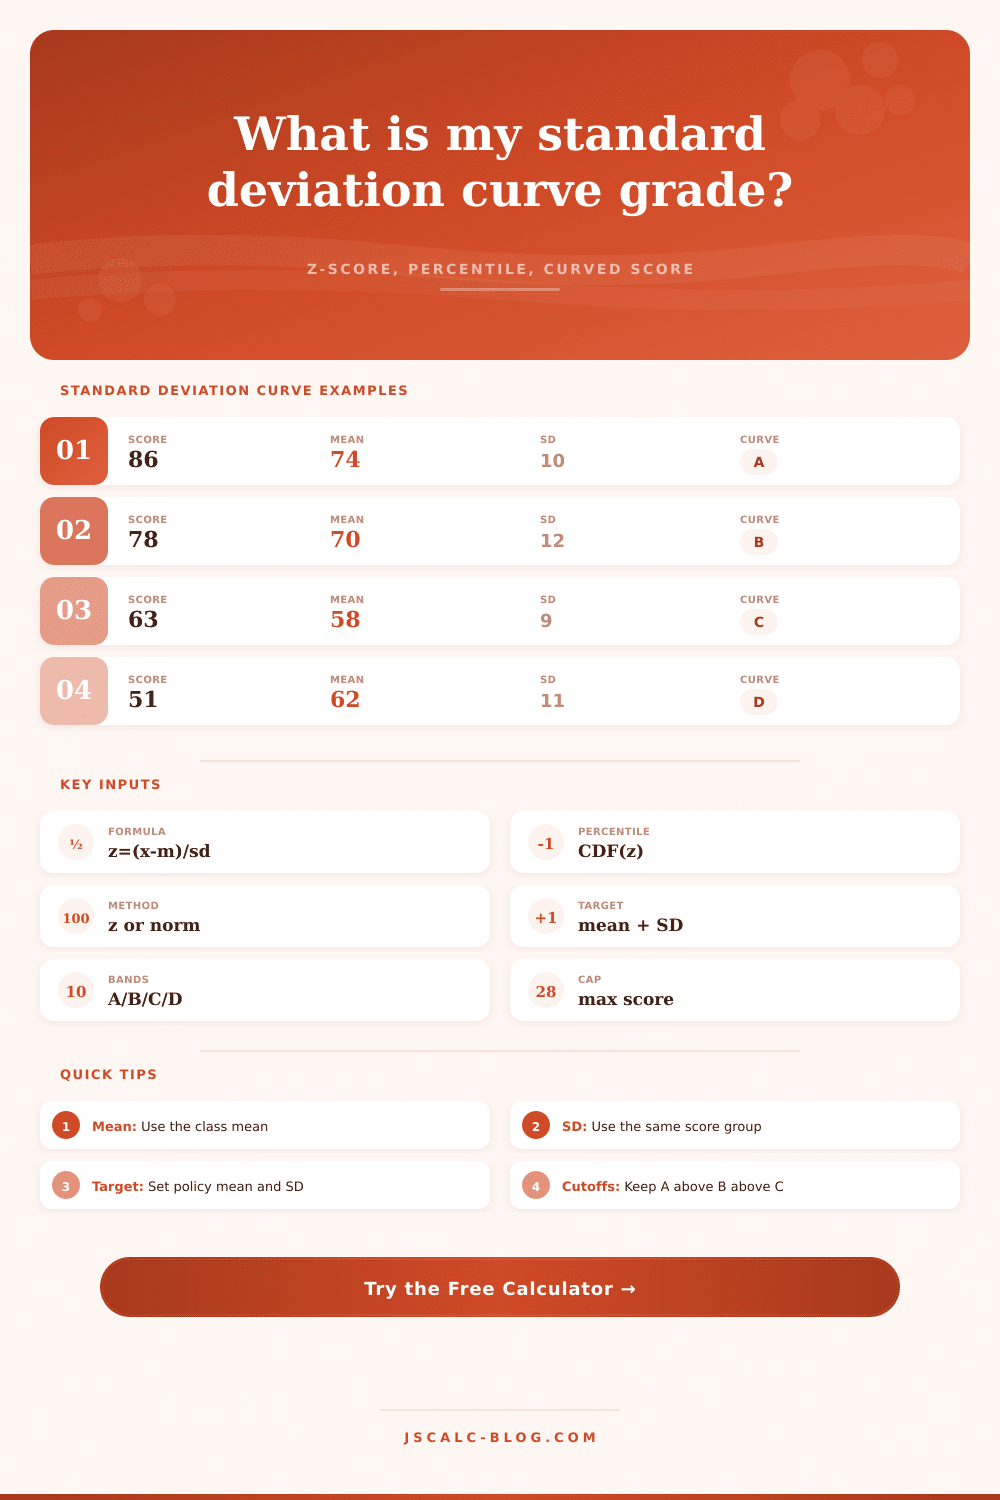
Now you get your test paper returned to you. The red ink say eighty-six out of one hundred. You feel sense of relief. But then you notice the class average in the corner. The mean is seventy-four. Now you’re not so sure if your score is an A at all. Or maybe it’s just a stroke of luck?
The raw number becomes part of a story, that’s what standard deviation curve does. It transforms that number into statement of relative performance. The math are run for you by the calculator above. Those stats become a crisp grade band and percentile. But clicking a button doesn’t make you understand what those outputs represent.
What Is a Test Curve?
Curve provides context. Raw score tell you what you know. Curved score tells you where you rank relative to everybody else. That’s where the z-score comes in. It takes both perspectives and creates something in between: the exact number of standard deviation your score is from class average.
If there were ten points of difference between the mean and your score (above), then your z-score would of be one point two. It’s a universal measure, a specific value. And it tells you that out of everybody who took the test, you did better then about eighty-eight percent of them. Whether the test consisted of five questions or five hundred makes no difference.
The calculator can changes the z-score into a percentage. And percentages is easy to understand compared to decimals. The real decision you face is choosing how to interpret that position. You need to decide what you want that position to mean.
Broadly speaking, there are two methods professors use. The first method is the z-band method. In this system, they establish concrete boundaries for each letter grade depending on how far away you sit from the mean. For instance, maybe an A corresponds to a z-score of 1.0. That means if you’re at 1.2, you’re comfortabley in the A-zone. But if you’re at 0.9, you’re still a B even if everybody else scored higher. This is a fair and strict method. It prevents a deflating curve. And it makes sure that letter grades matches real statistical extremes.
Normalization means that in this case, we don’t care about the letter so much as we care about shape of the whole distribution. Maybe the class mean is seventy-four, but teacher’s hoping for an eighty average. So he shifts all your score to get them on par with new target. Your z-score doesn’t change, after all, you’re in exactly the same place relatively speaking; but your raw score increase. It happens all the time in hard classes when the teacher thinks the test was too hard. Normalization changes your score without changing your rank. You still beat the same people; now you just do it with a bigger number by your name.
The key is to pay attention to standard deviation. When the standard deviation is small, this implies that the class’s scores was bunched up. That means a one-point difference might dramatically change your z-score. On the other hand, if the standard deviation is large, this indicates that the scores are highly dispersed (a lot of people got full marks) or the test were relatively simple (so everyone did well). Either way, the curve behaves in an opposite manner. Small = curve gets sensitive. Large = curve flattens out.
This is displayed in the reference table found on page. It displays what percentile your z-score become under different conditions. But there are common errors in mixing data from one source with another. Don’t take the mean of Quiz One and the standard deviation of Quiz Two. Valid stats has to originate from the same set of assessments.
Watch out for max score cap. If you’re on a normalized curve it’s possible your grade will go all the way up to one hundred and five. Fortunately, the tool caps it off at that point. Good to know the math won’t actualy blow past that hundred-point limit till the final step.
Understanding grading means knowing that it is as much an art as it is a science. It’s a framework and there are things beyond the numbers. There is no way for the numbers to take into consideration a section which all thought was confusing, or a poorly worded question. It just describes how the grades is distributed.
Take the tool for the baseline. Then use what you know about the subject to fill in the gaps. The curve tells you where you are, so now provide them with context.