Class Average Calculator
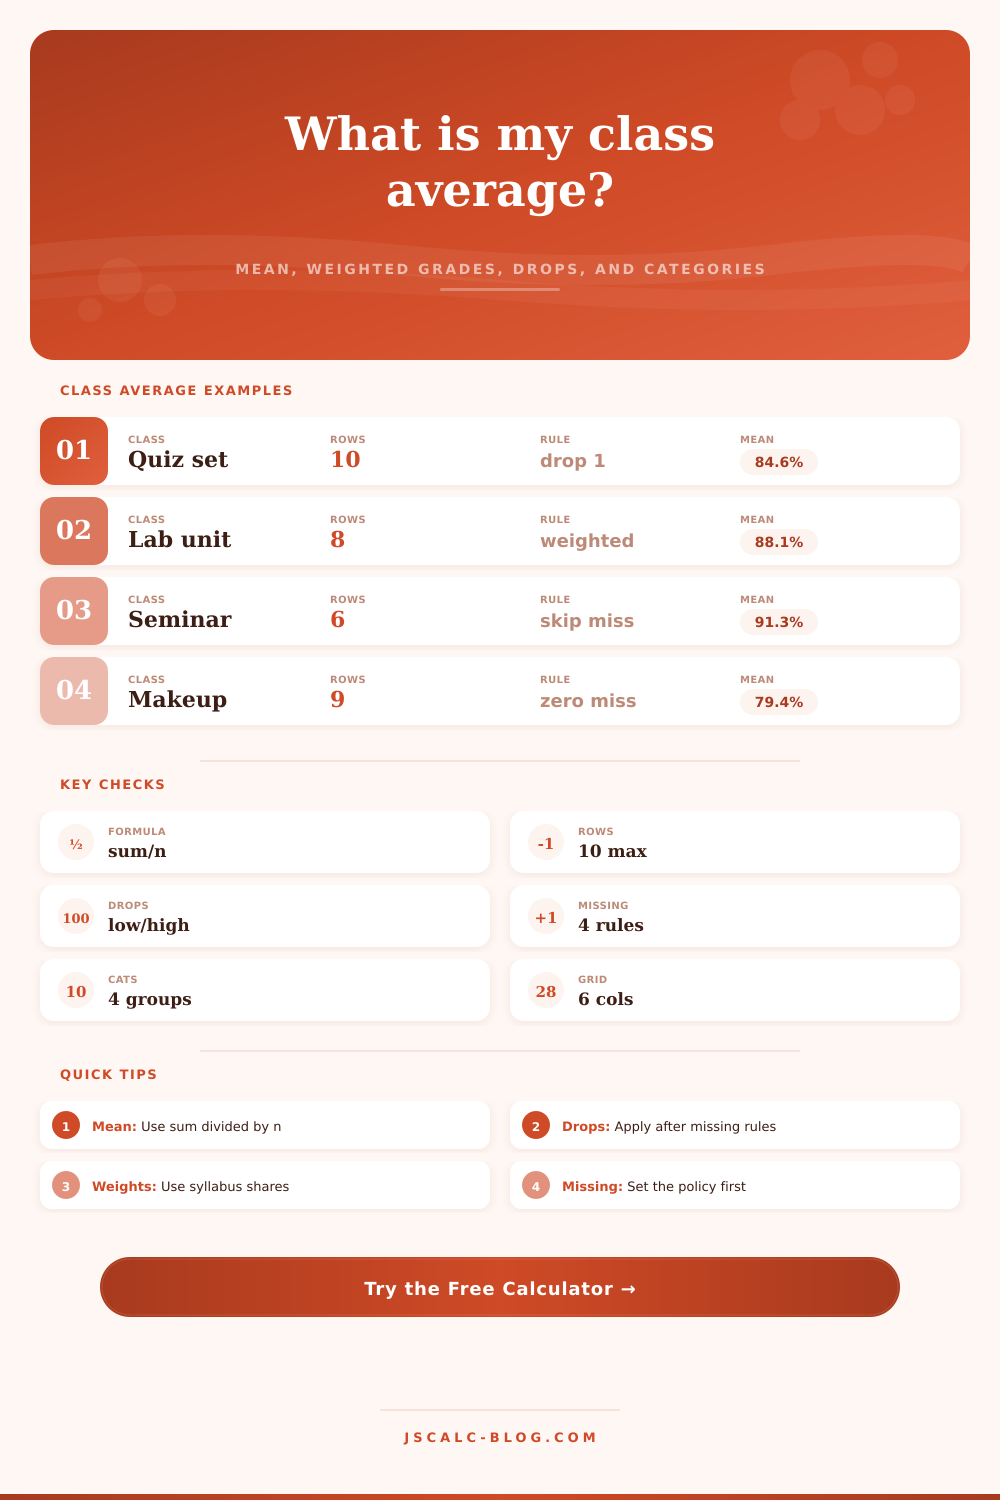
Calculate a class mean with the exact sum divided by n formula, then compare weighted average, category-weighted average, missing-score rules, and optional lowest or highest score drops for JSCalc-Blog.com gradebooks.
Load a realistic gradebook pattern, then edit any score, possible points, weight, category, drop rule, or missing-score policy.
Mean formula: class average = sum of included score percentages / number of included score percentages.
These weights only affect the category-weighted average. The plain class mean always remains sum / n after the selected missing and drop rules.
Enter up to ten scores. Possible points are ignored in percent mode; row weight can be points, credits, category share, or a frequency count.
| Label | Category | Raw entry | Percent used | Weight | Status |
|---|
| Category | Used rows | Score sum | Category average | Category weight | Weighted contribution |
|---|
| Band | Range | Count | Share of used scores | Class note |
|---|
| Policy | How the calculator applies it | Typical classroom use | Watch point |
|---|---|---|---|
| Skip missing | Blank score does not enter sum or n | Excused absence or ungraded makeup | Can make averages look higher than a zero policy |
| Zero missing | Blank score becomes 0 percent before drops | Missing required work | Drop-lowest can remove the zero if allowed |
| Custom missing | Blank score becomes the custom percent | Late-work floor or makeup estimate | Document the fill value before sharing results |
| Drop lowest | Lowest used rows are removed after missing handling | Quiz banks and homework sets | Do not use for required finals unless policy allows |
| Drop highest | Highest used rows are removed after low drops | Contest scoring or trimmed class checks | Usually not used for student grade reporting |
Every time I open up my spreadsheet and begin calculating class averages it feels like a puzzle I don’t want to solve. It’s supposed to be easy; you add all the numbers together and divide. Except, life isn’t tidy when it comes to grades. There is curves, weighted categories and missing assignments. Before you put too much faith in the numbers, you should of known what they realy mean. That is, it doesn’t make up your mind about how you will grade. You make that decision. And sometimes those decisions are as small as changing one little thing in rules. Then the class mean shifts a few points and that’s enough to pass/fail a student.
The only thing this calculator do is run the math for you, no division errors necessary. For example, this is where most teachers and students gets into trouble with missing work. Do they count that quiz as a zero? Or do they simply not even take the quiz at all? If they take it, it brings their average down. The zero implies they didn’t know material. But if they don’t take the test, it mean they weren’t there, right? It’s quick to switch between those two scenario on this calculator. It will show you what happens when you treat an empty spot as a zero. The average is not a hard fact; it is a reflection of whatever rules we’ve decided are in play.
Understanding How the Grade Calculator Works
Not all assignments are created equal. Some assignment weigh heavier than others. Typically an exam will carry more weight then a homework problem would. With this tool, you can absorbs weights to your categories (projects, exams, quizzes). In reality, this is similar to how gradebooks functions as well. Your syllabus might indicate that exams accounts for 40% of the grade. You could enter that weighting into the tool. The weighted average card then displays what the grade represents with weight taken into consideration. So, it’s not simply about the raw score but its also about the value of the score.
Another popular option is dropping low grades. Let’s say you want students to participate but don’t want to penalize someone for having a bad day, so you’ll drop their lowest quiz grade. After the calculator accounts for missing work, it will account for this drop. Note that the sequence do matter: The calculator handles missing work before it drops scores. Skip the missing work first and the zero won’t ever make it into the pool to get dropped. Forgive the missed day by dropping the zero. Try tweaking the settings to determine what seems most fair.
At the bottom is the distribution table which provides a snapshot that quickly tells us where people landed. It puts scores into bands and allows you to look and see whether the class are bunched up in the middle or spread out. This lets you know whether you might have needed to review this particular concept or whether the test was too hard. You’re not looking at just one number; you’re looking at the shape of data. That’s how you see variation that may be hidden behind the mean.
The problem with most of the stress over averages is that people don’t understand how to apply them. Do I take the category average? Or should I take the weighted sum? What about the plain ol’ mean? The page has a reference table that make this clear. What’s the denominator? When should I use one versus another? What’s my goal? You don’t have to be a statistician to do this correcty. Just figure out your goal: Are you after the final grade? Then you take the weighted version. After their raw performance? Take the mean.
But grading isn’t just a matter of numbers; it’s also a matter of communicating. Publishing a grade is telling a student where they stand. It should accurately and fairy show where they stand. This is where these tools comes into play: they remove guesswork from the equation and give you what you need. Set the rules, let the tool crunch the numbers, and get your result. You can defend it. It’s not magic, but it sure hurts less than doing it yourself by hand. Start out with a bunch of data and wind up with a crystal-clear picture.