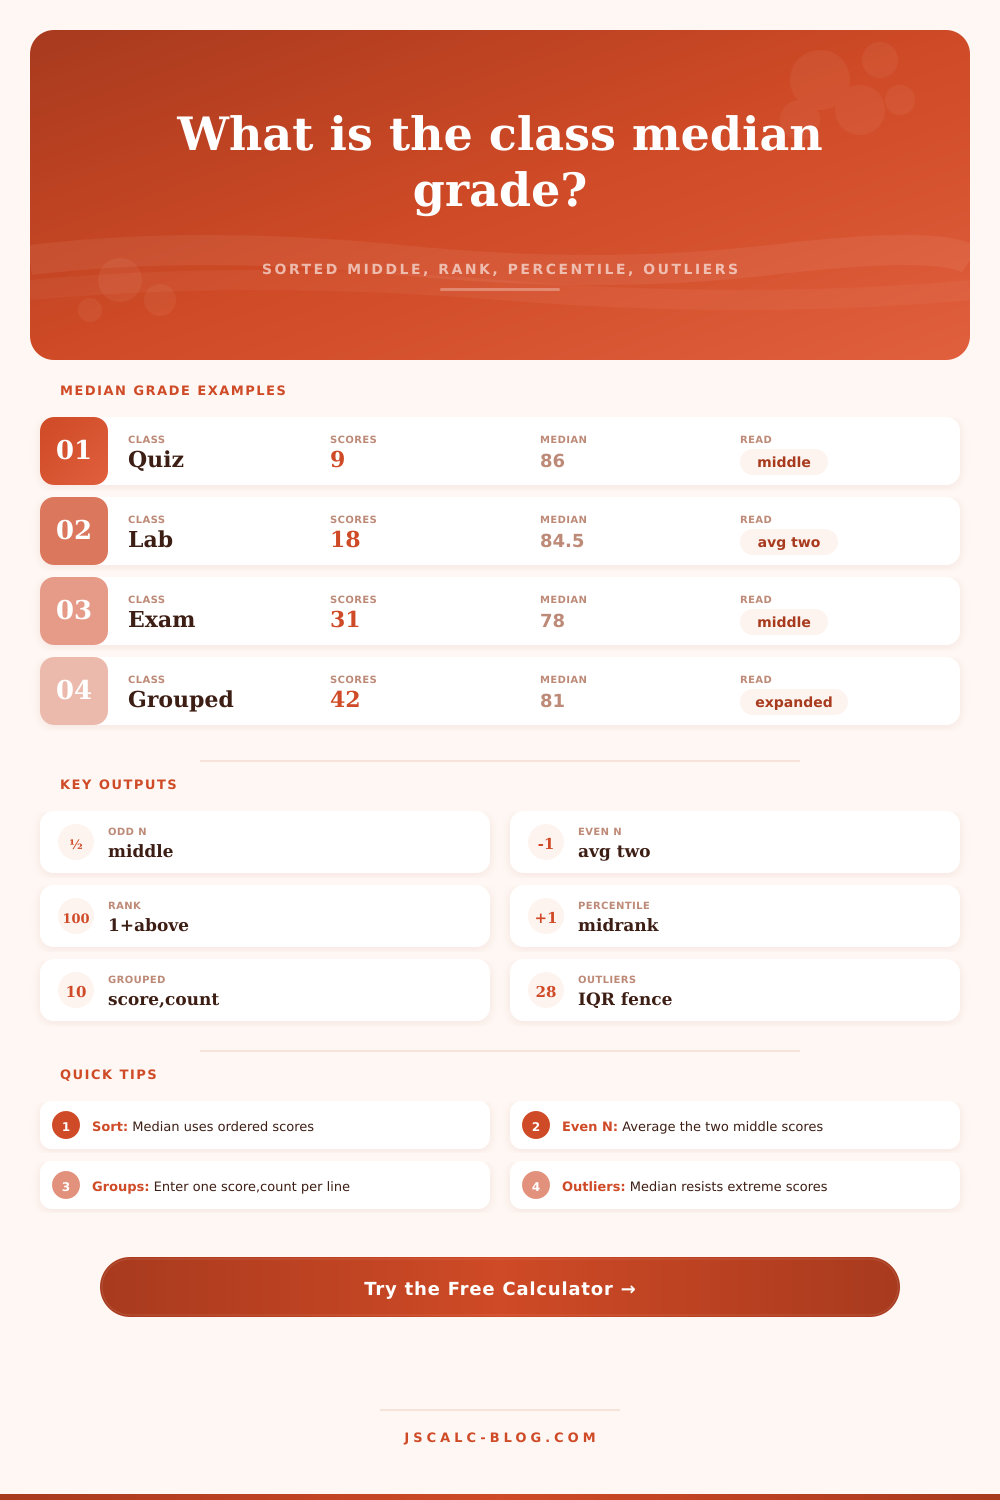
Class Median Grade Calculator
Sort a class score set, find the exact median grade, compare it with the mean, and see where a selected student score ranks in the distribution on JSCalc-Blog.com.
1 Class Presets
2 Scores And Options
Use raw mode for individual grades. Use grouped mode for frequency tables such as 88,5 or 88 x 5. The calculator expands grouped scores before sorting, so the median rule stays exact.
3 Class Snapshot
4 Live Tables
| Position | Score | Letter | Percent Of Max | Median Role | Rank From Top |
|---|
| Band | Range | Count | Share | Median Position | Reading |
|---|
| Target Score | Scores Below | Scores Equal | Scores Above | Percentile | Class Rank |
|---|
| Case | Sorted Positions | Formula | Result Type | Why It Matters |
|---|---|---|---|---|
| Odd class size | (n + 1) / 2 | Middle ordered score | Actual score | One student sits exactly at the center. |
| Even class size | n / 2 and n / 2 + 1 | Average two middle scores | Interpolated score | The median can fall between two students. |
| Grouped scores | Expanded by count | Same median rule after expansion | Exact if counts are exact | Frequency tables still produce the true median. |
| Target percentile | Below + 0.5 x equal | Midrank percentile | Relative position | Ties share the middle of their tied block. |
| Outlier effect | IQR or SD flags | Mean minus tail adjusted mean | Sensitivity check | Median should move less than the mean. |
5 Scale Reference
| Scale | A Range | B Range | C Range | D Range | Use Case |
|---|---|---|---|---|---|
| Standard | 90 to 100 | 80 to 89.9 | 70 to 79.9 | 60 to 69.9 | Common school reporting. |
| Plus/minus | 90 to 100 | 80 to 89.9 | 70 to 79.9 | 60 to 69.9 | Shows A-, B+, and similar cut points. |
| Strict | 93 to 100 | 85 to 92.9 | 77 to 84.9 | 70 to 76.9 | Useful for tougher grading policies. |
| Pass/fail | Pass | Pass | Pass | Depends threshold | Uses the pass threshold input. |
You know the mean. If you’re a teacher, it’s the number you tell your administration. It is average that curves the report card. It is stat that seems right by gut instinct.
But here’s the truth: The mean is a wobbly creature. Under pressure of outlier grades, it flexes and folds. An absent-minded kid with a zero on his exam bring down everyone else grade, turning an excellent class into a merely good one.
Why Use the Median Instead of the Mean
So what? The median is the storm anchor. It doesn’t give a hoot for the best score or the worst. It doesn’t care who made this list; it simply want to get you to the middle of your classroom and stay there.
That’s why the median grade calculator is the way it is. With one click, it’ll sort your grades, ignore the noise at the edges and point you directly toward the heart of your classroom.
The key here is to find the median. And how do you get the median? Easy! Just sort the list. If you’ve got an odd-numbered amount of students, then the median is whatever score happens to be smack dab in the middle. With 10 students, for example, the median would be half-way between 5th and 6th-highest scores.
Why does this matter? It’s a subtle detail, but it makes all the difference. Whether you’re grading a large lecture hall or a smaller quiz section, the tool automatically understand what to do. You simply copy-and-paste your grades and it figures out where they go.
What you get back isn’t the statistical average, it’s a grade that reflect the typical student. Imagine a class in which one half of students received scores in the seventies while the other half did much better with scores in the nineties. If the mean settles on the eightieth mark, then maybe this is a B-level class. But more than likely, the median would of been higher, indicating that most students are doing better than that average.
That’s not a flaw. That’s a feature. The median reveals something about the student experience. The mean reveals something about total number of points distributed.
Looking at the distribution allows you to see who’s exceling and who is struggling. The calculator breaks this down into bands so that you can see exactly how many students fall into any given letter grade range. From there, you can determine whether your grading curve is skewed by a few outliers or whether it’s fair.
The mean hates outliers. When a kid turns in a blank sheet of paper, the average drop dramatically. The median doesn’t care. That’s why it isn’t affected by extremes.
For example, that helps you diagnose how your class is doing. If the mean is much lower then the median, chances are that many kids scored low and pulled down the average. If the mean is higher than the median, a few kids got very high grades and pull up the average. The computer will flag these outlying points for you with its statistical fences. Then you can determine whether they’re an indication of individual issues or poor teaching. Getting this information in context is important when making proper judgments.
There’s also the case of grouped data. In this case, you don’t have each name paired with its matching score. Instead, you have frequency counts. Eight students received an 80. Eight received an 80. The calculator treats each count as if they were unique student, adds more data points, and calculates the median. That way there’s no guessing about where the middle is in a group of scores that are all similar.
You can toggle back and forth between raw/gathered modes on the interface which makes it useful depending on how you keep your records. You pick the appropriate grade scale. Different institutions uses different thresholds for A, B, or C. There’s also the option of using a plus/minus system, or a more rigid rubric. You can choose what works best for you. That way the median will have a meaningfull letter grade.
Little things matter when communicating with others. Consistent grades are what parents and administrators expect. The median gives you a clearer view of what’s going on right there in the center. It is perhaps less flashy than the mean, but it is more honest about the common experience.
What you’re doing when you run the numbers isn’t simply assigning a grade; you’re grasping the shape of your class. You are seeing its gaps, its clusters, and its spread. The quiet stability of the median anchors you in a sea of variance.
A half the class missed, half the class beat. And that balance is powerful: it enables you to explain performance with confidence, grade fairly, and teach better.
The mean shows you what happened overall. The median shows you what happened in the middle. Both are useful, though often the truth is hiding somewhere in the middle.