Decile Rank Calculator
Find a student's decile from class rank, convert percentile rank into a decile, handle ties with first-rank, last-rank, or midrank rules, and see the top 10% threshold on JSCalc-Blog.com.
Load a realistic ranking case, then adjust the rank, class size, percentile interpretation, or tie rule.
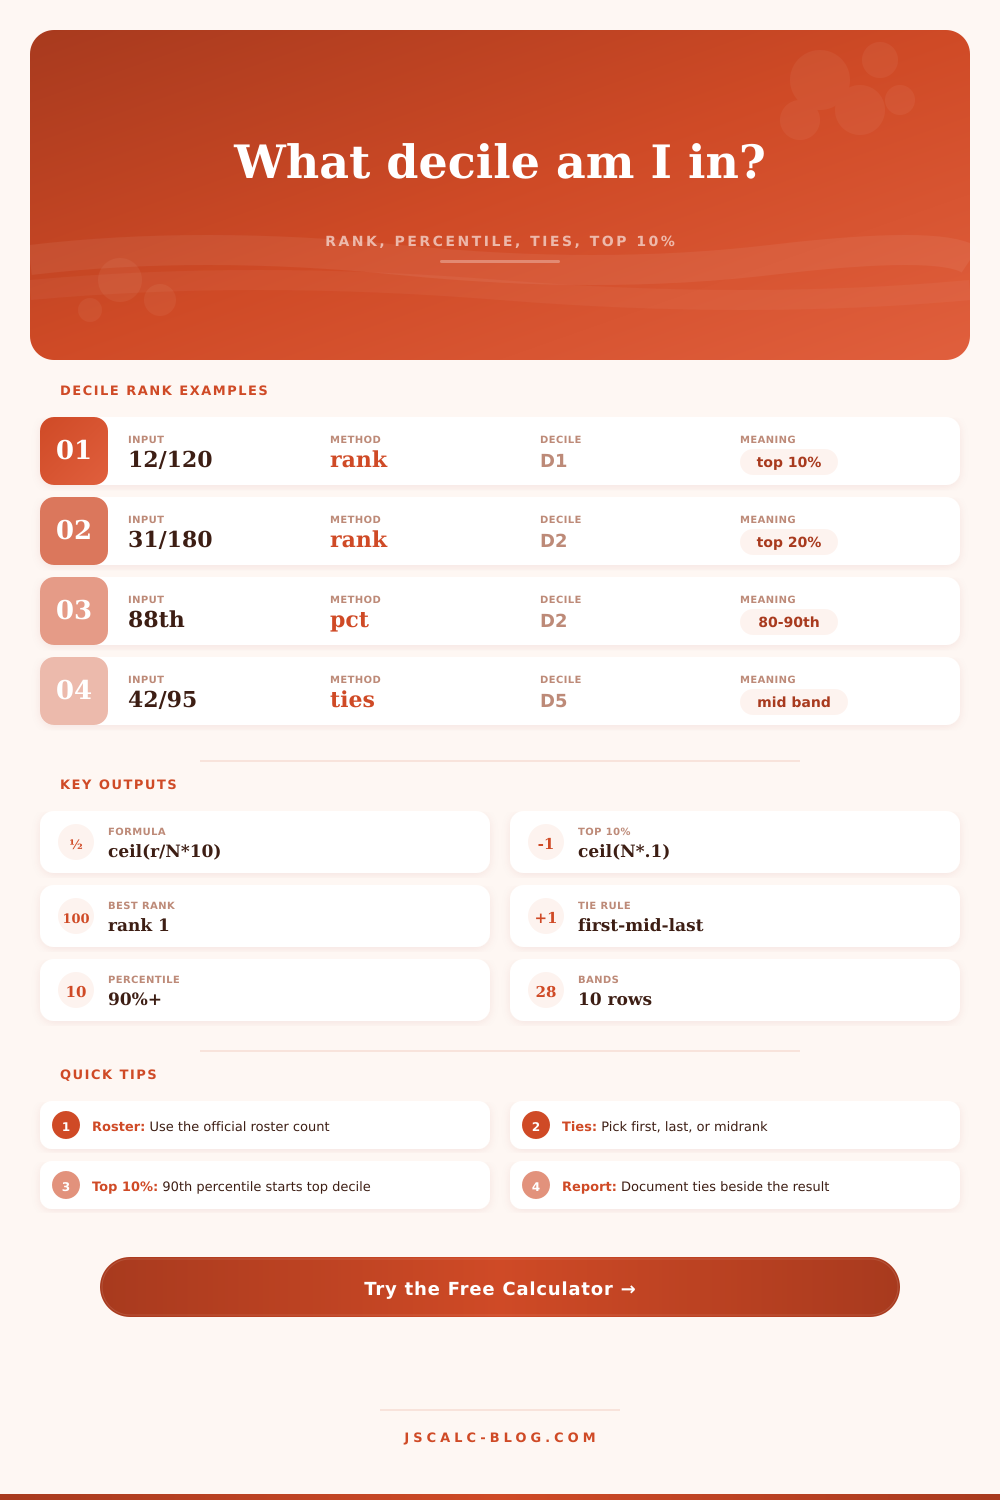
Formula: rank-based decile = ceil(rank / class size x 10). Rank 1 is the highest standing.
| Decile | Rank range | Top share range | Percentile band | Selected status |
|---|
| Target group | Maximum rank | Percentile needed | Selected gap | Interpretation |
|---|
| Convention | Effective rank used | Tie example: rank 20, t=4 | Decile effect | Common wording |
|---|---|---|---|---|
| First-rank tie | 20 | positions 20-23 use rank 20 | Most favorable | Tied for 20th |
| Last-rank tie | 23 | positions 20-23 use rank 23 | Most conservative | Rank after ties |
| Midrank tie | 21.5 | average of 20 and 23 | Balanced | Statistical rank |
| No tie block | Displayed rank | t=1 means one position | No adjustment | Ranked N of class |
| Decile | Rank formula band | Percentile rank band | Top-percent band | Plain-language label |
|---|---|---|---|---|
| D1 | 0% to 10% of N | 90th to 100th | 0% to 10% | Top decile |
| D2 | 10% to 20% of N | 80th to 90th | 10% to 20% | Second decile |
| D3 | 20% to 30% of N | 70th to 80th | 20% to 30% | Upper third area |
| D4 | 30% to 40% of N | 60th to 70th | 30% to 40% | Above middle |
| D5 | 40% to 50% of N | 50th to 60th | 40% to 50% | Near median high |
| D6 | 50% to 60% of N | 40th to 50th | 50% to 60% | Near median low |
| D7 | 60% to 70% of N | 30th to 40th | 60% to 70% | Lower-middle |
| D8 | 70% to 80% of N | 20th to 30th | 70% to 80% | Lower band |
| D9 | 80% to 90% of N | 10th to 20th | 80% to 90% | Ninth decile |
| D10 | 90% to 100% of N | 0th to 10th | 90% to 100% | Bottom decile |
The world becomes binary once you reach some point: You’re in the top ten percent, or you’re not in the top ten percent. While actual accomplishment is a continuous metric, it’s hard to escape sense that things feel binary at that point.
Deciles solve this problem, they divides each student’s achievement into one of ten equally sized groups. Analysts and admissions officers moves through sea of thousands of applications based off this decile ladder.
What Is Your Class Rank?
And then the problem comes up where you split hairs, how do you handle the boundary cases? How do you deal with students who sits right on the line? What tool can you use for that? Classes will report their ranking to you in one number. But that number obscures what’s happening on the roster.
The size of each decile depends on your class size. For instance, if there are one hundred twenty students in your class, they divides into groups of twelve by decile. For instance, if there are one hundred twenty students in your class, they divide into groups of twelve by decile. The twelfth student is in the first decile; the thirteenth student fall into the second. That’s a tiny difference with huge effects. By plugging in your exact class size and rank, the calculator eliminate the uncertainty surrounding the “did I make it?” question.
Be sure to double check the class size you input. Some schools includes ineligible students (e.g., withdrawals) or students who didn’t take certain classes in their rankings. This raises the denominator and alters everyone’s placement. To see how you stand accurately, look at official roster of ranked student.
Things get complicated when there are ties. If we have three kids tied for 12th place, it matters what order they go in. Is it the first-rank? In that case, everyone with a tie are included in the top ten percent (since technically every one of those tied kids has rank one). Or is it the last-rank? In that case, the people with ties will be ranked lower, since they are actualy occupying spots from 13 through 14. Or is it midrank? Then they’ll all be included in the middle of that grouping, somewhere around the average of those ranks. Depending on the convention, it will flip which kid gets to say he’s an elite student.
You can click and toggle between each convention and see that one little tie may knock you up or down a band. It shows that the system is arbitrary. It also shows you exactly where you would of fall in your situation.
Finally there’s percentiles, which are frequently mixed up with rank (raw number). That nice sounding 98th percentile? It’s still in the first decile band. How do we convert? Straightforward yet counter-intuitiv. Percentiles are the opposite of deciles, meaning higher percentiles matches with lower deciles because decile one represents the highest performing group. Many people mistakenly think “bigger is always better,” thus confusing themselves. Whether you’re reading about athletes ranked by percentiles, or standardized tests results reported via percentiles, understanding this inversion is key. Just enter your percentiles into the calculator which will tell you exactly what band you fit into.
The most watched line on the chart is the 10% cutoff. It’s where many merit scholarships and automatic admission pathways kicks in. This line can be unforgiving in a large class. One rank off and you miss all of the benefit structure. If you know exactly what rank the cutoff was, you can take actions that could help (i.e., appeal a decision, retake a test). It brings abstract competition to life: now there’s a tangible target.
In the end, it’s simply a convenient bit of statistics. It is a way to simplify and make something complex comparable. Whether you’re on the bottom or top side of the 2nd decile doesn’t change who you are. It won’t reflect your effort or nuance or potential, these are bands to manage volume at institutions, not to encapsulate you as a human being. Know how you stack up with numbers so you can use that knowledge, but don’t let the number be your worth. Your rank is a snapshot; it’s not a verdict.