Square Root Curve Calculator
Convert a raw test score with curvedScore = sqrt(rawPercent/100)*100, then apply a policy floor, cap, category weight, and side-by-side linear and additive curve checks.
Current score comparison
| Method | Formula | Before clamp | After floor/cap | Gain vs raw | Weighted contribution |
|---|---|---|---|---|---|
| Run the calculator to compare curve methods. | |||||
Square-root checkpoint grid
| Raw percent | Sqrt curved | Sqrt gain | Linear curve | Additive curve | Letter on selected scale |
|---|---|---|---|---|---|
| Run the calculator to build checkpoints. | |||||
Weighted category impact
| Category weight | Raw contribution | Sqrt contribution | Point gain | Linear contribution | Additive contribution |
|---|---|---|---|---|---|
| Run the calculator to show weight sensitivity. | |||||
Square-root curve quick reference
| Raw percent | Decimal p | sqrt(p) | Curved percent | Boost | Interpretation |
|---|---|---|---|---|---|
| 25% | 0.25 | 0.5000 | 50.0% | +25.0 | Very large rescue boost |
| 36% | 0.36 | 0.6000 | 60.0% | +24.0 | Moves a low score near passing |
| 49% | 0.49 | 0.7000 | 70.0% | +21.0 | Classic square checkpoint |
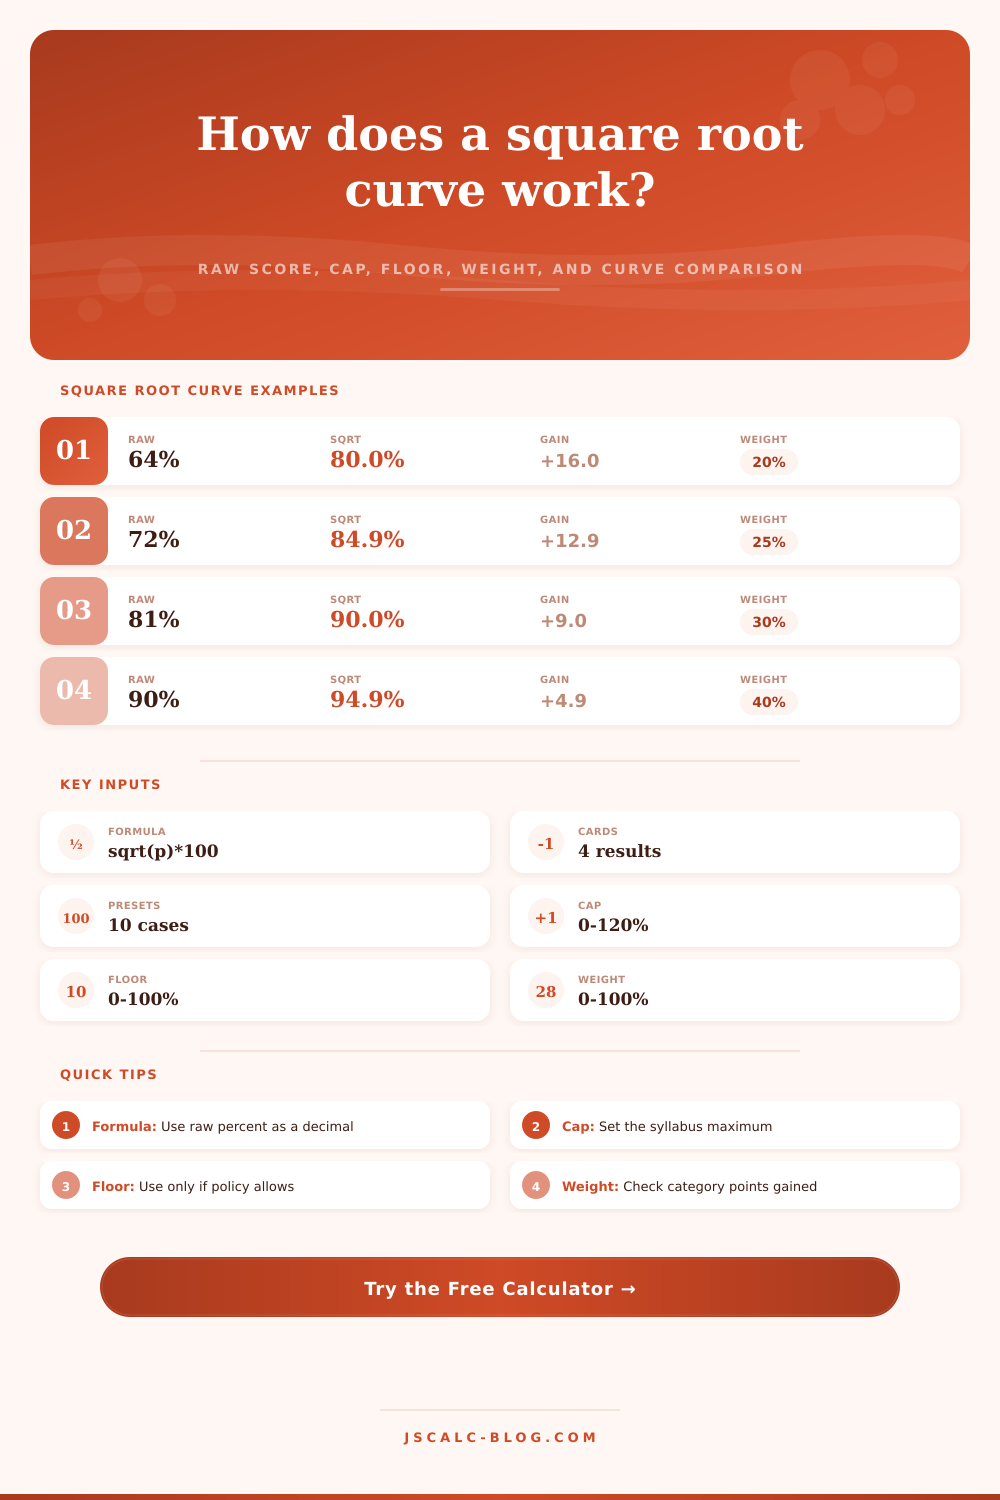
| 64% | 0.64 | 0.8000 | 80.0% | +16.0 | Middle score becomes solid |
| 81% | 0.81 | 0.9000 | 90.0% | +9.0 | B score reaches A range |
| 100% | 1.00 | 1.0000 | 100.0% | +0.0 | Perfect stays perfect |
Educational calculator only. Always follow the official grading policy, syllabus, department rules, and any required rounding method.
A minute later, you have handed back a test paper, and there it stares up at you: a sixty-four percent. You know that’s a C, maybe barely a C if syllabus has any teeth. Then the professor says they’re going to be adjusting the exam, applying a square root curve.
Now things get interesting: The math of this curve is intended to save middling scores but leave perfect ones intact. A kind of mathematical triage, it gives more help to those who need it most, those with middle-range score, than to those whose grades already shine like stars.
What Is a Square Root Curve
Understanding how it works is time well spent, since when you see one bad test score, it can feel as though the world is crashing down around you. Once you remove the angst from the equation, the concept itself is actualy pretty straightforward. Simply divide your raw score by one-hundred to turn it into a decimal. Find the square root of this decimal. Then multiply this value by one-hundred again to arrive at your new grade.
It might seem esoteric until you see what these numbers look like. So say you got that sixty-four percent? This becomes zero point six four. Its square root is zero point eight, which translates directly back to an eighty percent. Without any further study, you’ve increased by sixteen points. That’s huge, a massive leap from a so-so showing to a decent B.
The calculator up top does all the number-crunching for you immediately; there’s no need to whip out your scientific calculator while you’re in the middle of a freakout. But knowing how it works help you see why it makes such a difference.
This curve does something special with the score range. As you go lower on the scale, the boost is huge, but it tapers off quickly as you go up. So the square root of one (if you got a perfect hundred percent) is still one; you’re still at a hundred. You gain nothing there.
But if you’d gotten a fifty percent? The square root is around zero point seven zero seven, so your score goes up to seventy point seven.
Basically, what happens is that the bottom half of grading distribution is compressed by the curve. That’s the whole point. We want to make sure that someone who really understood the material isn’t unfairly bumped up to an A. At the same time, we want to make sure a single test or two doesn’t tank you, even if they ruin your semester. It rewards baseline understanding and effort without rewarding perfection.
When using the tool, pay attention to floor and cap as well. Most instructors will put a floor on their test to ensure nobody fails completely if class average is low. They’ll also place a cap on it to ensure their grade won’t go higher than one-hundred-percent (even though math says otherwise). You’re able to tweak this setting with the calculator to fit whatever rules your syllabus states.
For example, if your professor has a firm cap of 95%, then you want to plug that in to get your actual max possible. Without the cap, you might not realize how far off-base you are about your grade, so always double check the policies first.
It’s worth comparing this approach to a basic additive curve as well. A basic additive curve simply bumps up everybody by five or ten points, and that’s fair enough. But it’s pretty blunt: it equally helps both the strugglers and the high achievers. With the square root, we’re redistributing points according to need, which is a bit more subtle.
You can toggle back-and-forth with the tool and see how each approach work out for your own score. Occasionally a straight addition might work best if you’re a high scorer, but for folks who are scoring in the 50-80% range, the square root nearly always comes out ahead.
And weight counts. That’s sixteen extra points, but if this test was worth 20% of your grade then it’s more than sixteen points. It represents a meaningful chunk of your total semester score. Seeing the weighted impact as a number, the amount of points you’ve added to the course, gives you perspective on what your stress really means. Maybe a little boost on your midterm will keep your GPA up but a small bump on a small quiz isn’t going to save you either way. It lets you know where to apply your energy. Cry about a quiz. Game-plan around an exam.
And lastly: Curving isn’t an iron-clad rule; it’s a departmental policy decision. It’s mandatory in some places, forbidden in others, left to instructors’ judgement in still more. Your class rules provide context; they tell you how you should interpret the raw numbers. Did you know some curves apply to your adjusted score instead of your raw score? Some round grades up while others round down.) If you’re tight on a cut-off point, the difference of a point or two can mean a B minus instead of a B plus, so always check and make sure.
The tool will help you plan… But the syllabus will tell you what rules to go by. The numbers speak for themselves; the rules are what you should of lived with.