Flat Point Curve Calculator
Add the same number of points to every raw score, apply floor and cap limits, compare class average movement, test assignment weight impact, and see letter thresholds on JSCalc-Blog.com.
Raw and curved point breakdown
| Item | Raw percent | Flat points | Before cap/floor | Final percent | Equivalent points | Letter |
|---|---|---|---|---|---|---|
| Run the calculator to build the point breakdown. | ||||||
Class distribution from bulk scores
| Row | Raw score | Raw percent | Curved percent | Gain | Raw letter | Curved letter |
|---|---|---|---|---|---|---|
| Run the calculator to build the distribution. | ||||||
Letter threshold movement
| Band | Base start | Shift applied | Curved start | Raw points needed | Notes |
|---|---|---|---|---|---|
| Run the calculator to build thresholds. | |||||
Weighted assignment sensitivity
| Assignment weight | Course after raw | Course after curve | Course gain | Alt curve gain | Grade effect |
|---|---|---|---|---|---|
| Run the calculator to build weight sensitivity. | |||||
| Curve situation | Typical flat add | Floor choice | Cap choice | Average effect | Best check |
|---|---|---|---|---|---|
| One flawed question | Question value | 0% | 100% | Mean rises by same points | Match points to the flawed item |
| Hard exam | 5 to 10 pts | 0% | 100% | Middle grades lift evenly | Check top-score saturation |
| Minimum-grade policy | 0 to 8 pts | 50% or 60% | 100% | Low scores compress | Count scores changed by floor |
| Extra-credit style | 2 to 5 pts | 0% | 105% | Top scores can exceed 100 | Confirm syllabus cap |
| Letter-only relief | 0 pts | 0% | 100% | Numeric average unchanged | Use threshold shift table |
| Weighted final | 4 to 10 pts | 0% | 100% | Course impact scales by weight | Compare raw and curved course grade |
Educational calculator only. Follow the official syllabus, department grading policy, and required rounding rules before posting grades.
Then you hand back the midterm and realize you messed up question seven. Maybe the picture didn’t make sense; maybe the answer key were wrong; maybe the material was tougher then expected. A few student missed this question and lost five points due to no fault of their own. Your initial instinct? Give them all those points back.
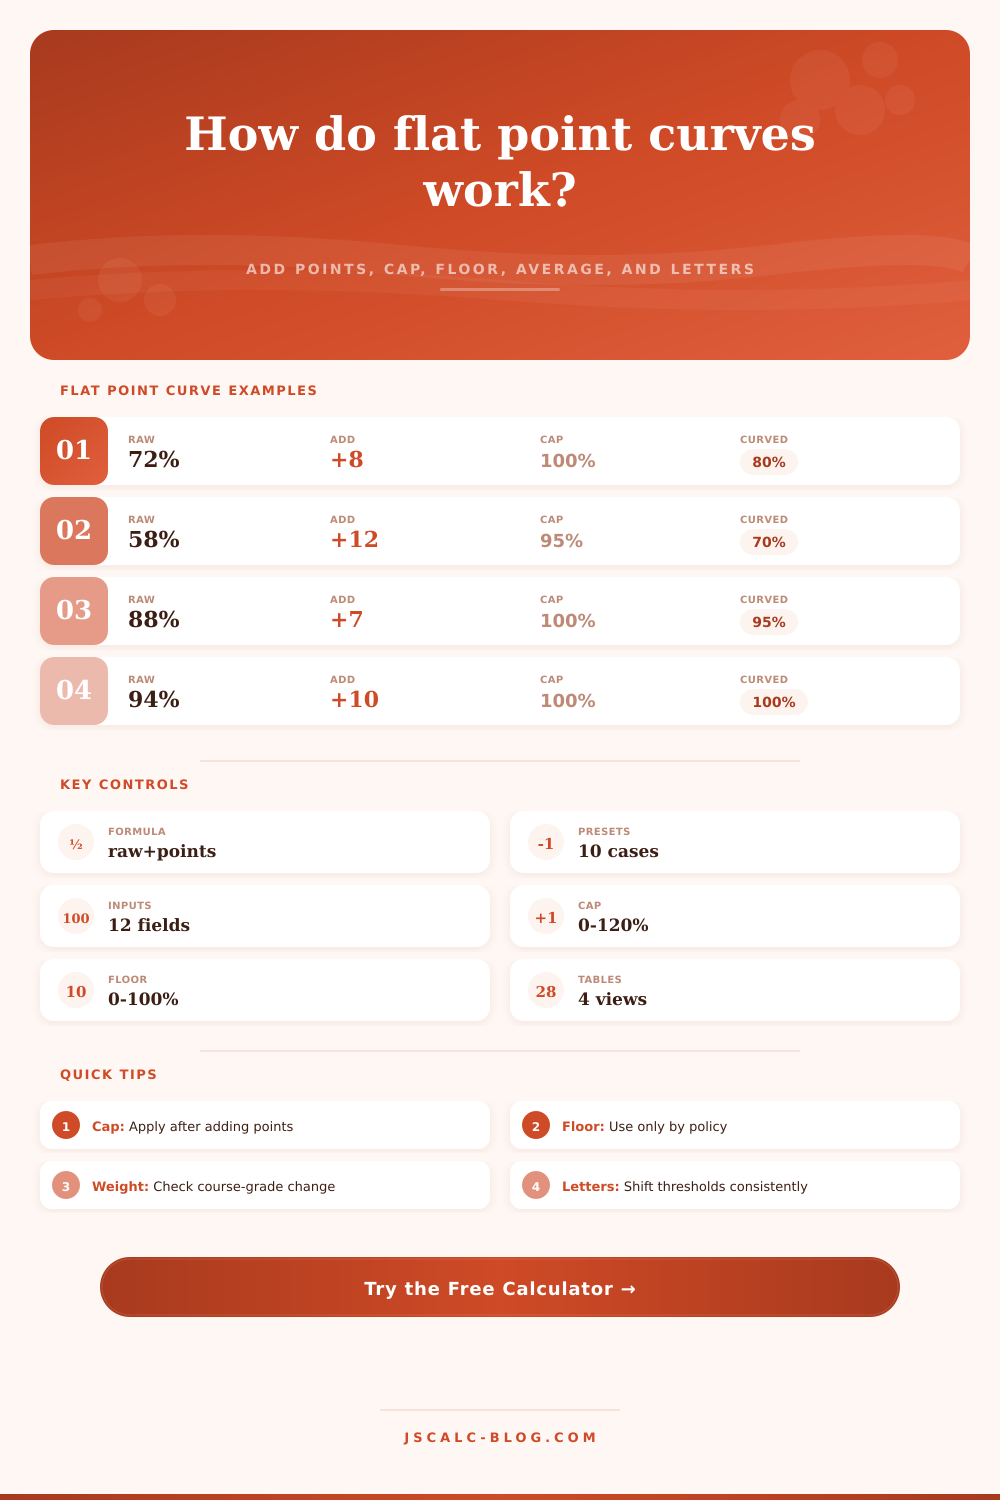
This isn’t just basic math; it’s also about fairness, perception, and your course policy. A flat point curve solve this problem. For the simplest adjustment, treating all student equally with a flat point approach will work. You simply add some amount to everyone’s score. For example, if you want to add eight points, then seventy-two turns into an 80, and ninety turns into a ninety-eight.
Using a Flat Curve to Add Points
It’s easy to see why this would feel fair, it’s a consistent mechanism. Each student gets the exact same bump in their grade. All that’s left is entering the raw score and the points to be added then letting a calculator figure out the rest. It saves you the guesswork on limits and rounding. Simply declare what seems right, and leave the complicated division calculation to someone else.
This approach has a drawback. A natural restriction in this solution is that there’s a hard ceiling on the high score. Most scores is capped at 100% unless your policy allow for extra credit. Adding ten points to a kid with a ninety-five doesn’t give them an extra five; it gives them a one-hundred, not a one-hundred-and-five. So the need for a cap is apparent. Without it, the curve will inflate the highest scores unrealistically. You could increase the cap if you want to allow extra credit. By leaving the maximum score as 100, even when correcting exams normally, it distinguishes between perfect and mastering content. With this option, you can turn the setting off and on to observe how many students reach the limit and who maximizes their gain.
Another change involves establishing a floor. Instructors may choose to set a minimum passing grade (e.g., 50% or 60%) that ensures all student remain enrolled in the class. That pinches the bottom of the score distribution. While this is kind to struggling students who would otherwise fail, it implies the curve isn’t strictly additive for them. For these students, their score doesn’t continue growing above the floor cutoff.
Setting a floor is a mercy policy; it’s not a statistical correction. Don’t confuse fixing a problem question with keeping people from failing. Correcting an error adds points. Keeping people out of trouble uses a floor. Merging the two can lead to confusion if you don’t explain what you’re doing.
Also, what’s the exam worth? The course grade includes a final exam, quizzes, and participation. The midterm is worth a portion of the total grade. How does curving the midterm by eight points affect your final letter grade? That depends on how heavily the midterm is weighted in the final score. On the one hand, if the midterm is only 20% of the course, then there will be less benefit from the eight point curve. It will mean less in terms of bumping up the overall average.
What we care about here… What the student cares about, is the weighted impact. And that’s what the calculator displays. Sure, an eight-point jump on a test sounds huge, but maybe it only translates into 1.6 points in the overall course average, which doesn’t raise or lower the letter grade.
This section compares percentages and letter grades. And here’s the part that matters: The focus of the student is not on percentages but on the letter grade. Did I go from a B minus to a B? This is the question that students care about, and it’s one we are able to help them visualize with our threshold shift.
If you run the curve, you’ll notice that the grading bands shifts. When you give a higher grade for reaching the same score, more people get As. If you add points, you shift the distribution up (meaning more people gets higher grades), but the boundaries stay the same. The result is the same but signals something different about what the teacher thinks is important.
Make it easy. Decide why you are making a change, make that change, and keep it consistent. Add points if the test was hard. Keep previous grades if the bar was high. It’s just math.
This is where the ethics of grading comes into play. Explain to students why their score is different. Is transparency better than kindness? Students will buy-in when they know why. You should of considered the impact first. Making sure everything is moddern and correct can be difficultly, but it helps the livig process. It actually makes sense based off how you want to treat people.