Scaled Score Calculator
Convert raw earned points into a clipped linear scaled score, or use a z-score model when you know the raw and scaled means and standard deviations.
Choose a realistic exam scale, then adjust the raw score, curve anchor, rounding, weight, or target.
| Target scaled | Raw needed | Raw percent | Gap from current | Status |
|---|
| Assessment profile | Raw range | Scaled range | Common anchor | Rounding | Best use |
|---|---|---|---|---|---|
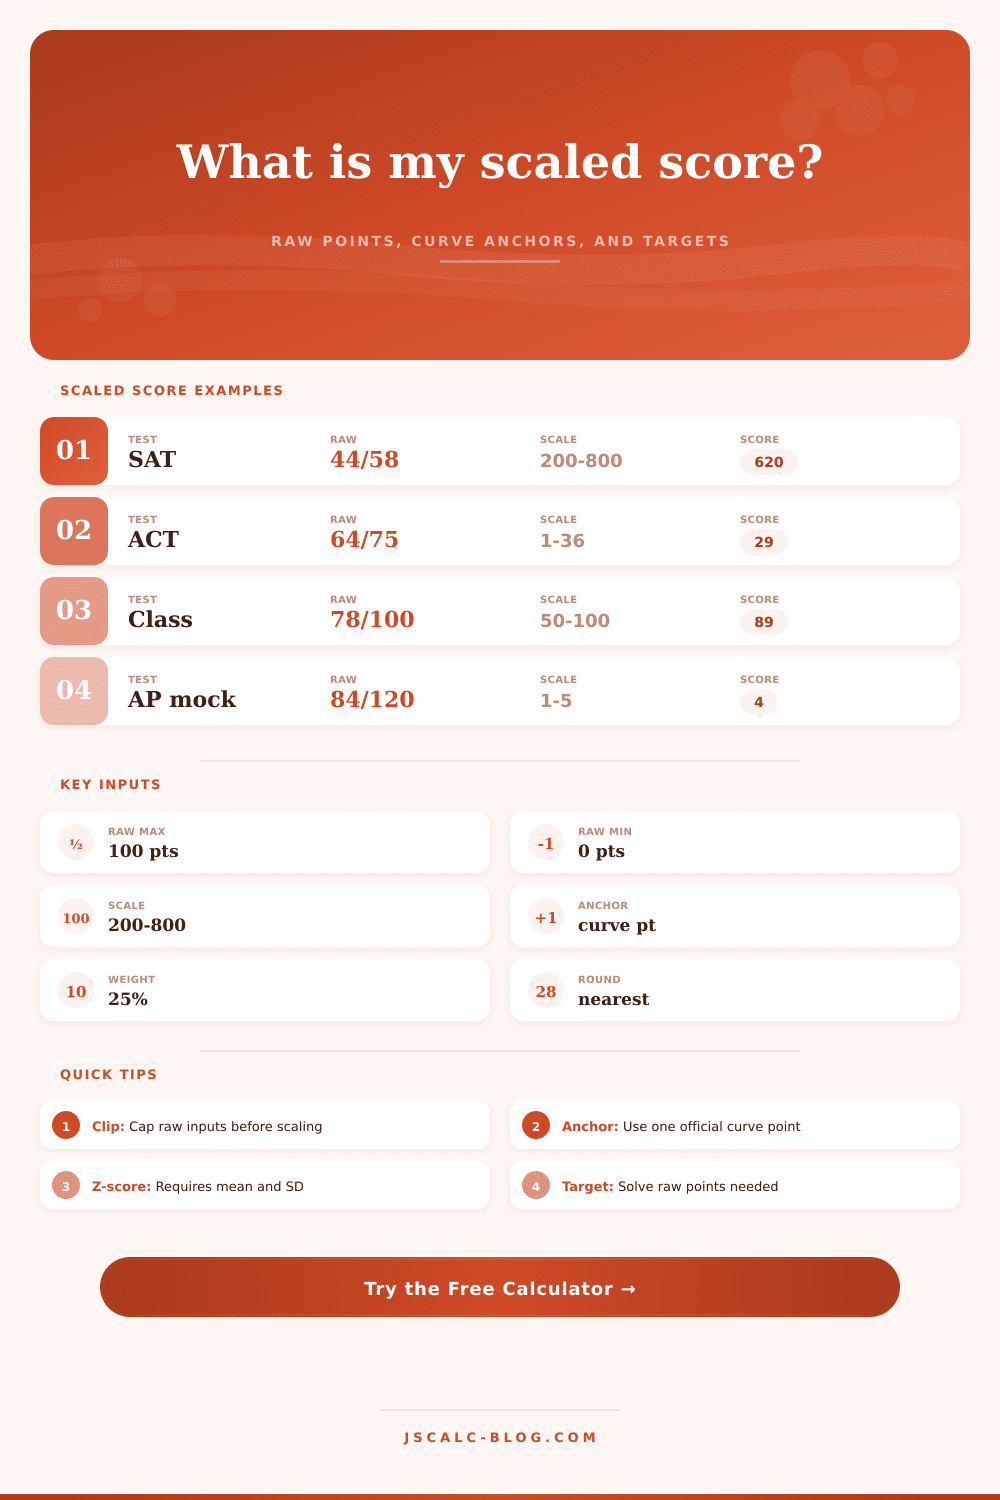
| SAT section band | 0 to 58 | 200 to 800 | 44 raw to 620 | 10-point table | College admission practice |
| ACT section band | 0 to 75 | 1 to 36 | 64 raw to 29 | Whole score | Section readiness estimate |
| AP mock exam | 0 to 120 | 1 to 5 | 84 raw to 4 | Nearest level | Practice exam translation |
| State benchmark | 0 to 50 | 100 to 300 | 34 raw to 235 | Whole score | Proficiency band checks |
| Class curve | 0 to 100 | 50 to 100 | 78 raw to 89 | Nearest tenth | Instructor adjusted scores |
| Placement test | 10 to 80 | 200 to 600 | 55 raw to 470 | Whole score | Course placement cutoffs |
| Certification exam | 0 to 90 | 100 to 500 | 63 raw to 390 | Whole score | Pass mark planning |
| Normed z-score | Any raw range | Mean plus z SD | Mean raw to mean scaled | Policy choice | Norm referenced reports |
| Method | Formula | Required inputs | Clipping point |
|---|---|---|---|
| Linear scaled score | scaledMin + (raw - rawMin) x (scaledMax - scaledMin) / (rawMax - rawMin) | Raw min, raw max, scaled min, scaled max | Raw and scaled ranges |
| Anchor adjusted line | Linear result + (anchor scaled - linear anchor result) | One official anchor point | Scaled range after offset |
| Z-score scaled score | meanScaled + z x SDScaled | Raw mean, raw SD, scaled mean, scaled SD | Scaled range if enabled |
| Target raw solve | Reverse the selected model for the target scaled score | Target score and active method | Raw range after solve |
| Setting | What changes | When to use | Watch out for |
|---|---|---|---|
| Nearest whole | Rounds 619.5 to 620 | Most exam scaled scores | Half-points can move up |
| Nearest tenth | Keeps one decimal place | Classroom grade curves | Not typical for official exams |
| Floor whole | Drops decimals | Strict pass cut policies | Can understate borderline scores |
| Ceiling whole | Rounds any decimal upward | Mastery retry policies | Can overstate official tables |
| Section weight | Scaled score x weight percent | Composite grade planning | Use the same scale for all sections |
Don’t view your raw scores as currency. Your raw score is merely number of questions you answered correctly. It provides no information about difficulty level of the test, nor how your performance compared to other students’.
Scaling take those numbers and converts them into something that has value. It aligns different test forms so your score means something consistent regardless of specific questions you received. This ensures that your score reflect your own performance, regardless of which question you happen to get.
How Test Scores Are Changed
It’s all very well for the calculator up there to spit out numbers for you, but knowing how it works let you check answers yourself. Linear scaling with clipping is most popular way of doing things: it takes your lower and upper limits on raw scores and plots a linear scale between the two. If your test ranges from 200-800, then a perfect raw score will map onto the upper end of that, and zero will map onto the lower.
Of course in reality it doesn’t work quite like this: typically test scores is clipped; they have a floor below which your number will be capped if you didn’t score as high as expected. That way no-one can guess madly and still achieve a good result based off random chance.
There are times when a simple straight line isn’t sufficient, which is why we need curve anchors. You may be familiar with using official score tables, such as this one. If you’re taking something like the ACT or SAT, you probably are. For example, a raw score of 44 generaly corresponds to a scaled score of 620. Plug your anchor point into tool and whole line moves to match what’s official. That’s helpful when you’ve taken an assessment like the ACT or SAT and the raw-to-scaled-score relationship is never quite a perfect diagonal. Here’s a reference table on the page illustrating how various assessments chooses to anchor their scores to ensure consistency of scores over time and across multiple testing days.
Another one that many people don’t understand are the z-score model. Here, you look at your results against the average to see how well you are doing compared to everyone else. The idea here is: if you have the standard deviation of the group and their average raw score, then this will tell you where you rank statistically. You’re not simply looking at how many right answer you got; instead, you’re looking at how much better (or worse) you did than the average person taking the test. This is typical when dealing with norm-referenced tests in which you want to know how you stacked up different than a certain population.
This also leads into rounding. Rounding matter on the test. A half a point can push you over a cutoff for a placement class or a scholarship. Some courses curve using tenths and some floor them so that they’re stricter. Most official exams round to the nearest whole number, but some classroom curves use tenths or floors to be stricter. Don’t assume you know what will happen with rounding in a sim. You could of get lulled into a false sense of security. This may seem like a small thing but if you’re planning out how much time to spend studying, then this does matter.
Lastly, the reverse logic of target raw score makes this one of my favorite features. Instead of telling me what my raw score results in as a scaled score, it does the opposite. It tells me what raw score I need to get if I want to reach a certain scaled score. That means I can put down real goals for studying. Want to make a 550? The tool knows and will tell you exactly how many points you’ll have to get to reach that. It also factors in whatever anchoring/clipping messes with the raw scores.
In the end, it’s all about being consistent and fair. Whether you took the test in the morning or the afternoon, what matters is that a certain score means the same thing. Whether questions were hard or easy does not matter; they are suppose to be consistent.
If you want to memorize the formulas, go ahead. But that’s not necessary. What you realy have to know is that raw points aren’t the full story. Those rules of the test itself are the rest of the story. And once you get to know them, the numbers won’t seem so mysterious. They’ll be useful. That’s what scaling does. It takes a list of right and wrong answer and makes it into a measure of your actual ability.