Percentile Score Calculator
Convert a score into a tie-aware percentile rank, estimated normal percentile, rank position, and target percentile score for JSCalc-Blog.com.
Enter counts, mean, and standard deviation to calculate percentile rank.
| View | Formula | Current result | Interpretation |
|---|
| Target percentile | Estimated score | Approx rank in N | Score gap |
|---|
| Percentile | Meaning | Approx top share | Typical wording |
|---|---|---|---|
| 50th | Middle of the comparison group | Top 50% | Median range |
| 75th | Higher than about three quarters | Top 25% | Upper quartile |
| 80th | Higher than about four fifths | Top 20% | Strong standing |
| 90th | Higher than about nine tenths | Top 10% | Top decile |
| 95th | Higher than about nineteen of twenty | Top 5% | Very high standing |
| 99th | Higher than about ninety-nine of one hundred | Top 1% | Extreme upper tail |
| Scenario | N | Below | Equal | Percentile formula | Competition rank |
|---|---|---|---|---|---|
| Single score, no tie | 40 | 31 | 1 | (31 + 0.5) / 40 = 78.75% | 9 of 40 |
| Three-way tie near top | 120 | 108 | 3 | (108 + 1.5) / 120 = 91.25% | 10 of 120 |
| Large equal-count band | 250 | 160 | 18 | (160 + 9) / 250 = 67.60% | 73 of 250 |
| Bottom tail score | 75 | 8 | 2 | (8 + 1) / 75 = 12.00% | 66 of 75 |
| Perfect top score tie | 30 | 27 | 3 | (27 + 1.5) / 30 = 95.00% | 1 of 30 |
| Median tie group | 101 | 48 | 5 | (48 + 2.5) / 101 = 50.00% | 49 of 101 |
Your test score is 84. That looks like a pretty good number! Well, maybe, depending on what else the number represent. Raw data never tells you anything meaningful unless you compare it against some other benchmark. If that’s true, then percentile ranking are the answer: it takes one piece of data (your single score) and converts it into a relative position. In other words, it lets you know how you stack up.
Why do most folks skip right over here? Because they don’t understand the context. A score of 84 in a class full of straight As doesn’t mean the same thing as a score of 84 in a class whose grade are weighted heavily toward low numbers. The point is: you can’t realy benefit from this tool unless you first understand the inputs: not just your score, but also how many people scored lower than you and how many tied with you.
What Percentile Ranking Really Means
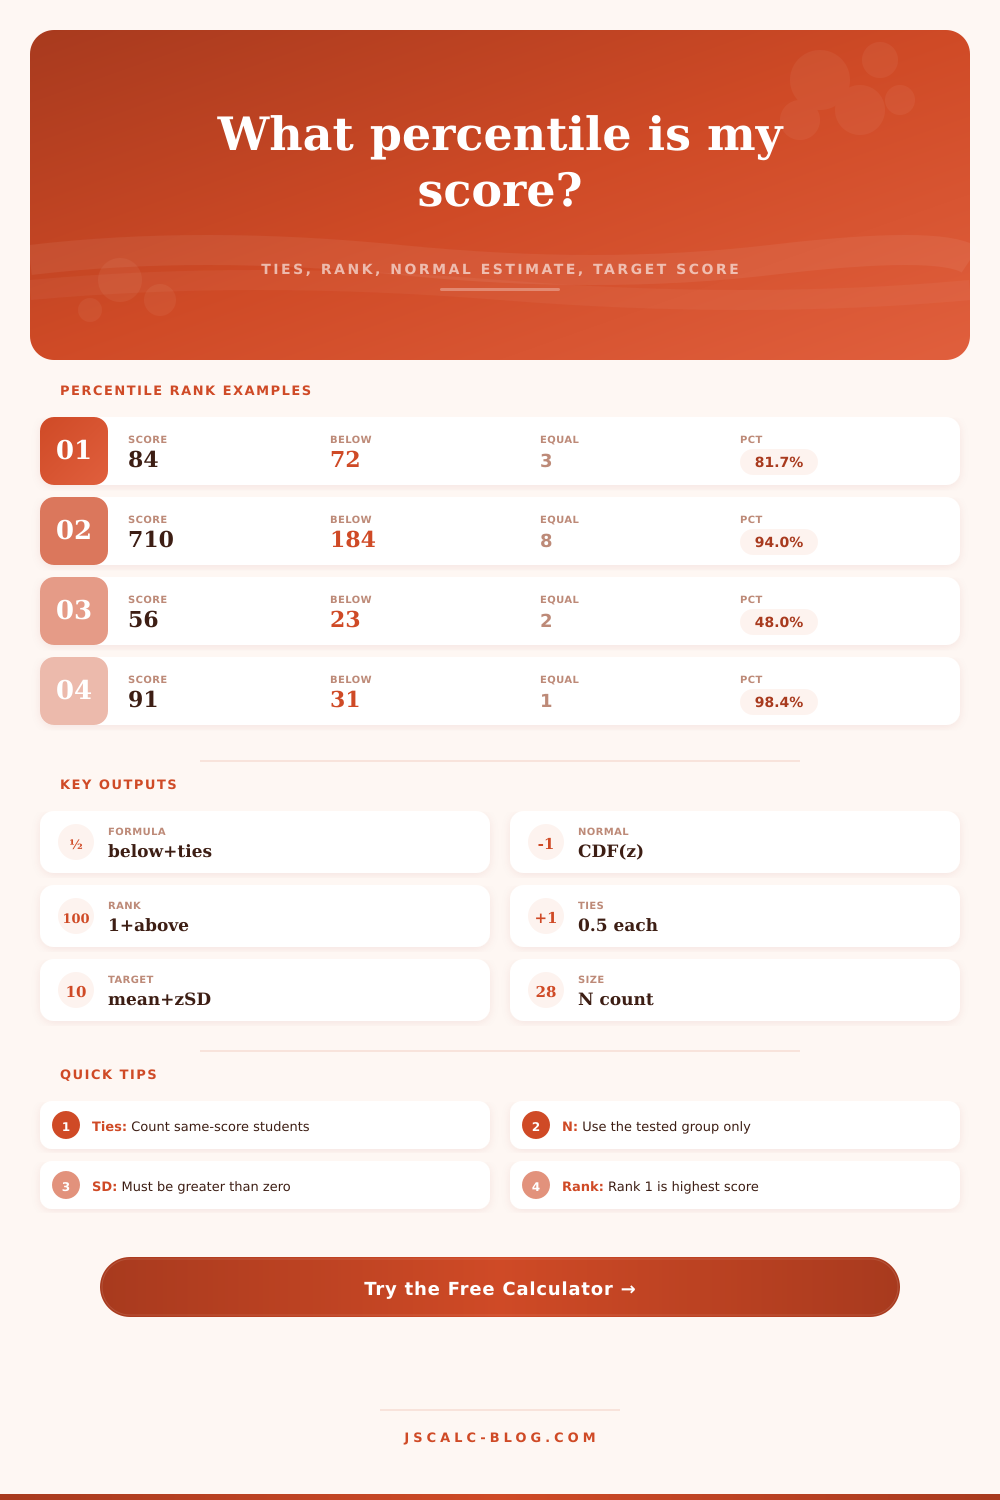
People are typically tripped up by the number of ties. Let’s say five kids got an 84. Saying they’re all either above or below you skews things. The typical empirical formula correct for it by assigning half-credit to the tied scores. So instead of being at one end or another of that group, it put you right in the middle. That provides a more accurate picture of where you stand different than just bumping everyone who got the exact same score up or down. That’s especially important if you’re deciding if you made the cut into a top-tier scholarship or program.
There’s also the normal distribution estimate. Based off the mean and standard deviation, it estimates how far below (or above) the middle of a hypothetical bell curve your score would be. When you have some idea of test’s general statistics, but no complete roster data, this can help. Depending on the distance between your actual percentile and the normal estimate in the calculator, you’ll find out if the normal distribution is a good fit for the test. Is the sample size insufficient? Or does the distribution skew toward one end of the spectrum? Identifying the difference means avoiding too much reliance on math model, which doesn’t account for what actualy happens with the test results.
Then there’s the complication of ranking conventions. Do they use competition ranking (tied players shares the highest position, with the next rank skipping ahead)? Or do they use a moddern version, such as dense ranking or another way to handle ties? And then how do they break ties? You can toggle between all this in the calculator. It makes a difference. Depending on the rule set, you may find yourself higher; or lower.
See how your story would of change. If you’re tied for first with 5 other, that’s very different than being ranked first in the class, even though you had the same score. With this approach, your goal becomes the destination, which means you have something to reverse-engineer. The tool will predict what score you’d need in order to reach the 90th percentile (assuming the distribution doesn’t change).
Planning is one thing. But it’s not a promise. The test changes. The distribution shift. Still, having a target number gives you something concrete against which to measure yourself. It is something more real than just wanting to improve; it is a clear goal instead of a vague wish.
The percentile itself provides only a slice of context. It measures where you are compared to other people. It does not measure what you know, what you could do, or how good you were at it. Understand that the percentile is a snapshot and set your goals accordingly. It will tell you where you stand and how ties may impact your standing; use it as a tool. Know also that the 84 is still nothing more than a score when you don’t know who else got an 84… now you’ve got the framework for getting that information.