Standard Score Calculator
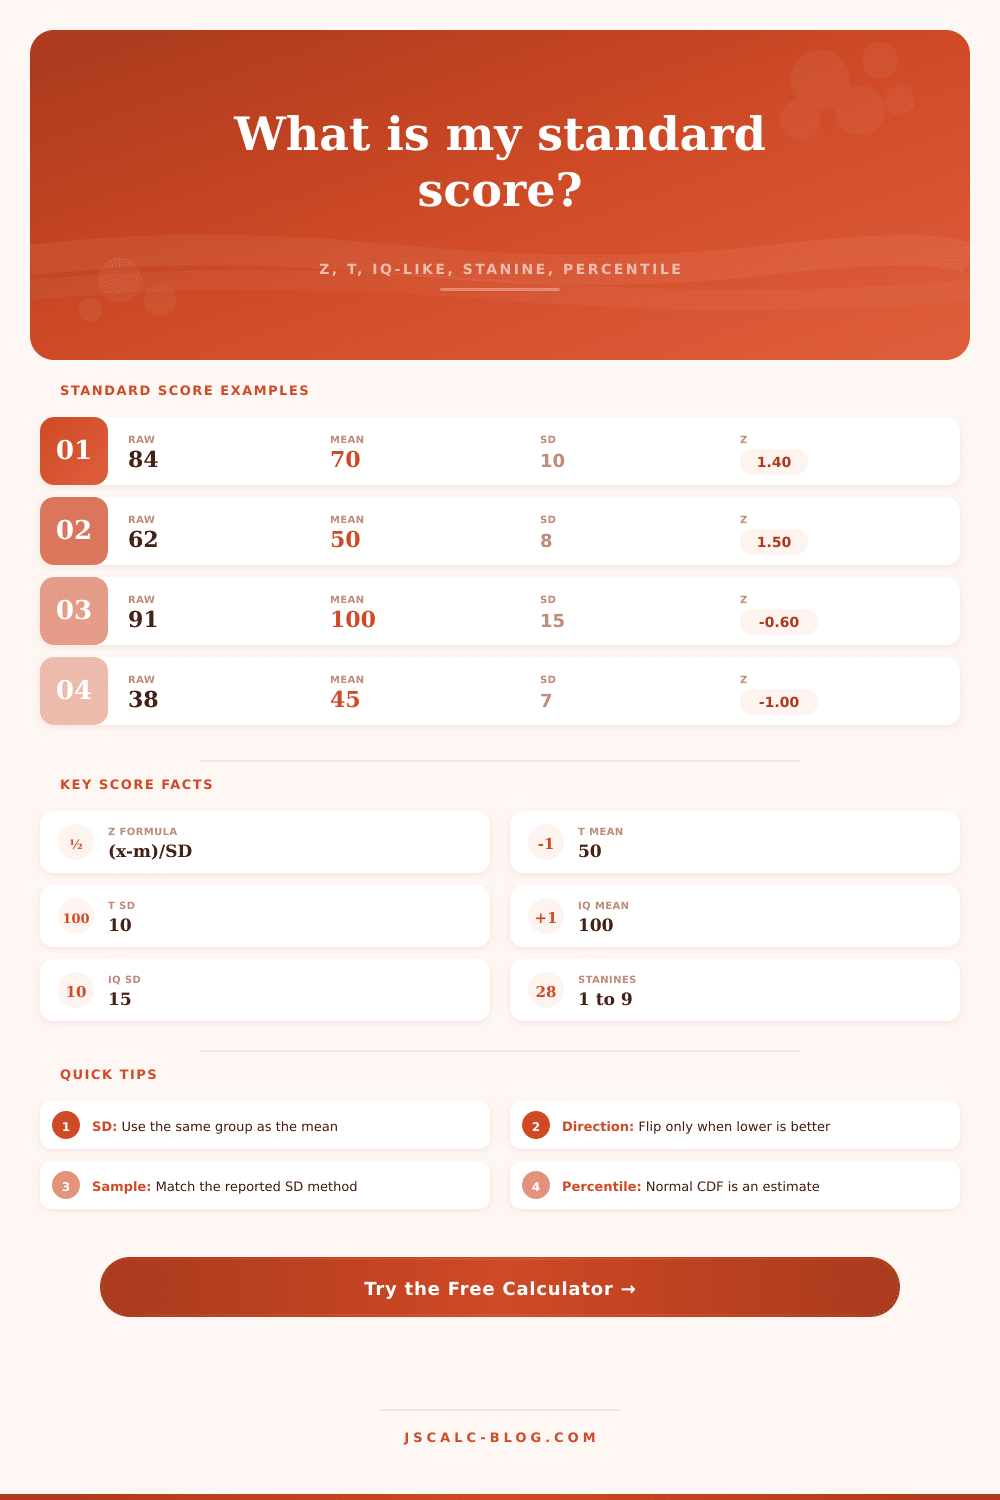
Convert a raw score to z-score, target standard score, T-score, IQ-like score, stanine estimate, and normal percentile using the formula z = (x - mean) / SD.
The score being standardized.
Use the same group and score scale as x.
SD must be positive.
The selected SD is used directly in z.
Used to show the alternate denominator estimate.
Changes the directional standing, not z.
Examples: 100 for IQ-like, 50 for T-score.
Examples: 15 for IQ-like, 10 for T-score.
| Band | z Range | Percentile Area | T-score Range | IQ-like Range | Stanine |
|---|---|---|---|---|---|
| Very low | Below -2.00 | Below 2.3% | Below 30 | Below 70 | 1 |
| Low | -2.00 to -1.34 | 2.3% to 9.0% | 30 to 36.6 | 70 to 79.9 | 2 |
| Below average | -1.33 to -0.44 | 9.1% to 33% | 36.7 to 45.6 | 80 to 93.4 | 3 to 4 |
| Average | -0.43 to 0.43 | 33% to 67% | 45.7 to 54.3 | 93.5 to 106.5 | 5 |
| Above average | 0.44 to 1.33 | 67% to 90.9% | 54.4 to 63.3 | 106.6 to 120 | 6 to 7 |
| High | 1.34 to 2.00 | 91% to 97.7% | 63.4 to 70 | 120.1 to 130 | 8 |
| Very high | Above 2.00 | Above 97.7% | Above 70 | Above 130 | 9 |
| Stanine | Normal Percentile | Approx z Cut | Plain Meaning |
|---|---|---|---|
| 1 | 1st to 4th | z below -1.75 | Lowest broad band |
| 2 | 5th to 10th | -1.75 to -1.23 | Clearly below average |
| 3 | 11th to 22nd | -1.22 to -0.77 | Below average |
| 4 | 23rd to 39th | -0.76 to -0.26 | Low-average range |
| 5 | 40th to 60th | -0.25 to 0.25 | Middle range |
| 6 | 61st to 77th | 0.26 to 0.76 | High-average range |
| 7 | 78th to 89th | 0.77 to 1.22 | Above average |
| 8 | 90th to 95th | 1.23 to 1.75 | Clearly above average |
| 9 | 96th to 99th | z above 1.75 | Highest broad band |
| Scale Name | Mean | SD | Formula From z | Common Use |
|---|---|---|---|---|
| z-score | 0 | 1 | z | Statistics and normal curves |
| T-score | 50 | 10 | 50 + 10z | Tests, screening scales |
| IQ-like | 100 | 15 | 100 + 15z | Cognitive-style reporting |
| SAT-style section | 500 | 100 | 500 + 100z | Large standardized exams |
| Stanine | 5 | About 2 | Percentile band | Broad educational reporting |
| Custom scale | User set | User set | M + z * SD | Local conversion tables |
| z | Percentile | Right Tail | T-score | IQ-like |
|---|---|---|---|---|
| -2.00 | 2.28% | 97.72% | 30 | 70 |
| -1.50 | 6.68% | 93.32% | 35 | 77.5 |
| -1.00 | 15.87% | 84.13% | 40 | 85 |
| -0.50 | 30.85% | 69.15% | 45 | 92.5 |
| 0.00 | 50.00% | 50.00% | 50 | 100 |
| 0.50 | 69.15% | 30.85% | 55 | 107.5 |
| 1.00 | 84.13% | 15.87% | 60 | 115 |
| 1.50 | 93.32% | 6.68% | 65 | 122.5 |
| 2.00 | 97.72% | 2.28% | 70 | 130 |
If you live long enough, you will see standardized scores everywhere. On your psychological assessment? Check. Your medical screening? Got it. Report card? You betcha! You just don’t always notice.
Why? Standardized scores exist on all these reports because they contain raw numbers that look meaningless unless you know what they mean. An 84 could be a sign of genius or a call for remedial assistance depending on the test. What’s different isnt the number; rather, it is context of the group who took the test.
Understanding Standardized Scores
This is where standard scores comes into play. They connect personal performance with group data. Plug in the standard deviation, the group mean and your raw score into the calculator above. It do the rest of the math for you.
While most folks grasp the idea that mean = average, it’s the standard deviation that realy explains what’s going on. Standard deviation measures the spread of scores. When every single score is exactly the same (i.e. If every score is 70, there is zero deviation. The real world looks like this: Scores bunch up at the middle and taper off at the edges. A big standard deviation indicates a lot of scatter and any given score isn’t all that unique. A small standard deviation indicate a tight crowd and anything even slightly different than the average is quite notable.
The language of stats is universal: Z-scores. They remove the units being tested. Then, they describe where you sit in relation to the mean by showing how many standard deviations you are above or below it. If you recieve a z-score of zero, this indicates that you were dead center-average. If you get a one, then you’re one standard deviation above average. That puts you at about the eighteenth percentile. In other words, you did better then about 84% of the rest of the class.
It’s powerful because it puts various tests on the same scale. How well do you do writing an essay for history class compared with how well you do taking a math test? Even though one might be graded on a scale of twenty and the other on a scale of one hundred, you can make those results match by converting them both into z-scores.
But this is where the tool becomes useful. It takes that raw z-score and turns it back into something more recognizable: an IQ-like score, for example, or a T-score. This is simply a scale with a different average and spread to remove big decimal places and negative values. For example, T-scores has a mean of 50 and a standard deviation of 10. IQ-like scores have a mean of 100 and a standard deviation of 15.
They are the same mathematical computation; they just look better. T-scores are favored by clinicians because they are easy to plot on a chart. One-hundred-mean scores are popular among psychologists, as they feel more precise and detailed to their patient. Usually, the difference in interpretation isn’t affected by the selection of scale, only the appearance of your report will differ.
There are many ways to think about this. Another way is that Stanines expand the brush. Instead of telling you your exact percentile, they put you in one of nine bands. Stanine five is the middle band, which represents the broad range of average performance from the fortieth to the sixtieth percentile. This helps avoid over-interpretation: If I score ten points higher than you, we’re still statistically the same person, so don’t freak out. For reporting education, where tiny changes in points shouldn’t result in huge interventions, it’s a small thing, but it matters.
On the page itself, you’ll find the reference table that lays out the bands. These show how a negative z-score of minus one.75 puts you in the bottom stanine.
The most frequent error is mashing up your reference groups. If your raw score is from some special classroom exam, don’t use the mean and standard deviation of some national norm group! Often a small class will have more or less variability than the larger population as a whole. The calculator allows you to indicate that your standard deviation represents a sample rather than a full population, which affects the denominator of the formula. This injects a subtle bias by using the wrong thing. It’s just a technicality, but accuracy depend on those details.
In addition, interpretation depends on direction. Higher is better (except for symptom count and race times). Lower is better. You can invert the direction so that the percentile represents how you rank relative to others. So if you outperform other runners, then your raw time will be lower. But your performance will be higher. The software handles that flip for you so you don’t have to mentally switch back and forth.
In conclusion, a standard score is simply another question. It asks, “Compared to whom?” Without this question, a number is just ink on a page. With this question, it is a coordinate on a much bigger map of performance. Whether you’re reading data or looking at your own test result, the most important thing you can do is remember that value depends on context. Finding where you stand on the map is something you’ve could of used the tools for.