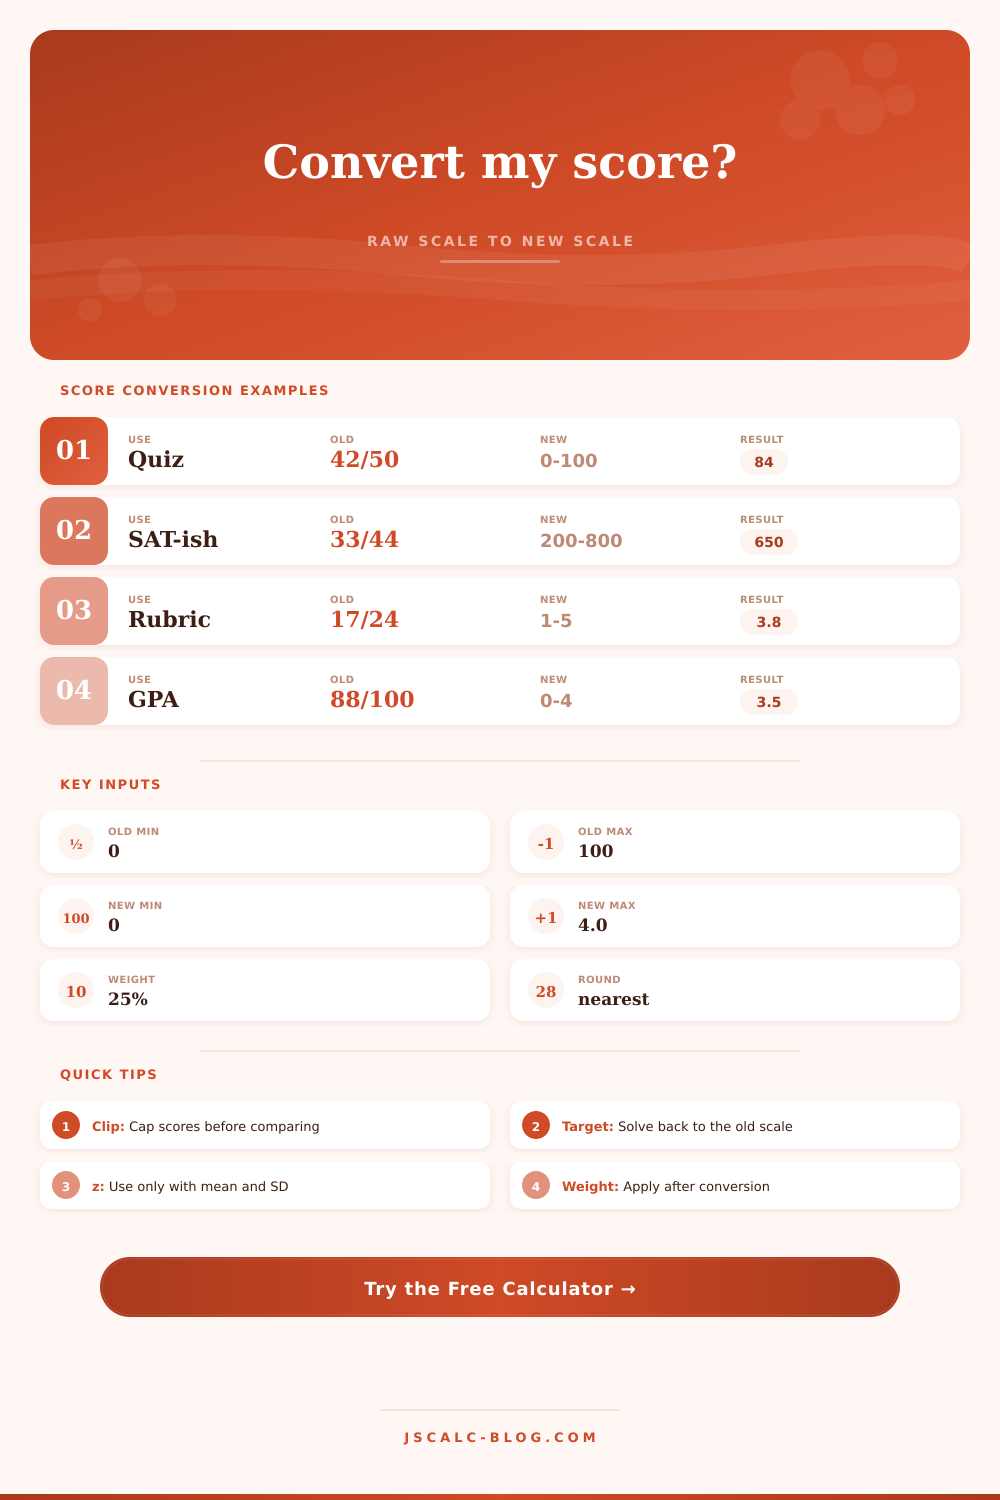
Score Conversion Calculator
Convert a score from one scale to another with linear interpolation, optional z-score conversion, rounding, clipping, section weighting, and target score solving.
Choose a common conversion setup, then edit any score range, rounding rule, clipping rule, weight, or target.
Linear uses the endpoint formula; z-score uses the norm fields.
The score to convert from the original scale.
Lowest meaningful value on the old scale.
Highest meaningful value on the old scale.
Lowest value on the converted scale.
Highest value on the converted scale.
Applies after clipping and before section weight.
Clipping caps values at the selected scale limits.
Converted score contribution to a composite or grade.
Used to solve the old-scale score needed.
Used for z-score conversion.
Must be greater than zero.
Center of the destination norm scale.
Destination scale points per z-score.
| Target New Score | Old Score Needed | Old Range Percent | Gap From Current | Status |
|---|---|---|---|---|
| -- | -- | -- | -- | -- |
| Scenario | Old Scale | New Scale | Typical Rounding | Use Case | Target Check |
|---|---|---|---|---|---|
| Quiz to percent | 0 to points | 0 to 100 | Nearest tenth | Class grade entry | Percent goal |
| Rubric to 5 | 0 to rubric max | 1 to 5 | Nearest tenth | Performance ratings | Band threshold |
| Percent to GPA | 0 to 100 | 0 to 4 | Hundredth | Planning estimate | GPA target |
| SAT-style | 0 to raw max | 200 to 800 | Whole score | Practice exam scaling | Section target |
| ACT-style | 0 to raw max | 1 to 36 | Whole score | Practice section | Composite goal |
| IB-style | 0 to 100 | 1 to 7 | Whole score | Course conversion | Level target |
| Certification | 0 to items | 100 to 500 | Whole score | Pass mark planning | Cut score |
| Normed report | Raw distribution | Mean and SD | Policy based | Standard score report | z threshold |
| Rule | What It Changes | Example | Best Fit | Caution |
|---|---|---|---|---|
| No rounding | Keeps decimals | 84.372 | Audit math | May look too precise |
| Nearest whole | Rounds to integer | 84.5 to 85 | Exam scores | Half values move up |
| Nearest tenth | Keeps one decimal | 3.76 to 3.8 | Rubrics and GPA | Check local policy |
| Floor whole | Drops decimals | 89.9 to 89 | Strict cutoffs | Can understate result |
| Ceiling whole | Rounds upward | 89.1 to 90 | Mastery retries | May overstate official result |
| Input clipping | Caps old score | 105 to 100 | Bounded tests | Hides extra credit |
| Output clipping | Caps new score | 4.2 to 4.0 | Published ranges | Can mask overshoot |
| Old Range Position | 0 to 100 Scale | 1 to 5 Scale | 0 to 4 Scale | 200 to 800 Scale | 1 to 36 Scale |
|---|---|---|---|---|---|
| 0% | 0 | 1.0 | 0.00 | 200 | 1 |
| 10% | 10 | 1.4 | 0.40 | 260 | 4.5 |
| 25% | 25 | 2.0 | 1.00 | 350 | 9.8 |
| 50% | 50 | 3.0 | 2.00 | 500 | 18.5 |
| 75% | 75 | 4.0 | 3.00 | 650 | 27.3 |
| 90% | 90 | 4.6 | 3.60 | 740 | 32.5 |
| 100% | 100 | 5.0 | 4.00 | 800 | 36 |
When you see that a 42/50 isn’t the same as a 42/100 at the end of the day, you begin to get a sense for whats called scale conversion. It’s simple math (or so it seems). But it’s also context. Without converting scores between scales, you can’t even compare the raw numbers from one test to another.
That’s where this converter works its magic. After you plug in each range for the tests you are comparing, it calculates the numbers for you. This saves you from trying to estimate if that great raw score will be converted to a good percent. Most do the latter (divide by total points) but forget about all the details associated with exam weightings and normalizations.
How to Convert Test Scores Correctly
The default method here is linear interpolation: it expects the test to be evenly spaced with similar levels of difficulty over its entire range. If you’re in the middle on the old test, you’ll end up in the middle on the new test. It is a straight line from beginning to end. That’s great when grading paper tests in a classroom setting, where every score has equal value. Just plug in the min/max scores for the current test and desired scoring scale and you get a proportional mapping of your score. It is simple, transparent, and easy to understand for both a colleague and the student. And if there is a trick involved, it’s simply knowing what’s really being assessed.
But not all score distributions are linear. You might have a norm-referenced test that shows how far above or below a group average a given score falls instead of using an absolute number. Enter the z-score mode: it needs the mean and standard deviation of the original score plus the intended mean and standard deviation of the new scale. While more complicated, this tends to be more precise for bigger assessment scales such as standardized tests. The scores is normalized based off spread (i.e., the higher-performing student will stay high, regardless of whether the test was particularly hard).
Applying the linear conversion to non-linear data skews the results; be aware of the shape of your data. You’ll also see options to round and clip results. While these look like cosmetic changes, they’re not. The clipping prevents grades from exceeding the reasonable range on a scale (you don’t want a grade higher than 4 or a percent higher than 100). And the rounding defines how precise your result will be. In some contexts, like certification exams, you might need whole numbers. Other times you really need tenths, like when using a rubric for scoring. That can make the difference between a pass/fail for a cutoff score. It might seem small but it isn’t. Always double check the official policy before setting anything in stone so that you aren’t accidently inflating/deflating results.
The other important element is weighting. When you combine your multiple scores into one total, each must be weighted correctly. For example, if one exam represent 25% of your overall score, then the conversion should of been applied and then multiplied by that weight. The calculator has a box for this so you can view how much each section contribute to the bigger picture. It’s the distinction between what you earned as a component score versus what you earn as part of a composite. This is where most folks drop the ball until it’s too late, they add them up and find their final score inflated in ways that don’t actualy represent their performance.
The page has a reference table to show the effects of various inputs across common situations. Perhaps the greatest benefit though is it allows for target solving. That is to say instead of simply converting your existing scores, you can work backwards towards what you need. The tool lets you tell it you want a certain result (for example a 90 on a new scale) and it will tell you what you would need on an old scale in order to get there. From that point, you no longer worry about doing better; you now aim at a number. For those looking to track their progress toward a certification, or prepare for an exam this is really valubale. It gives them something concrete to shoot for.
And lastly: Score conversion is for clarity and fairness. Students following their own path of learning, employers comparing job candidates, and teachers grading a classroom all want to be able to compare apples-to-apples. The math isn’t difficult, but how you weight, round, and choose which method to use make all the difference. Do that well, and the numbers speak. Do that poorly, and you’re simply rearranging digits. It is a little thing, but it is important.