Satellite Coverage Area Calculator
Calculate horizon central angle, spherical cap area, ground footprint radius, percent of a body's surface, and a minimum elevation angle footprint approximation for satellite coverage.
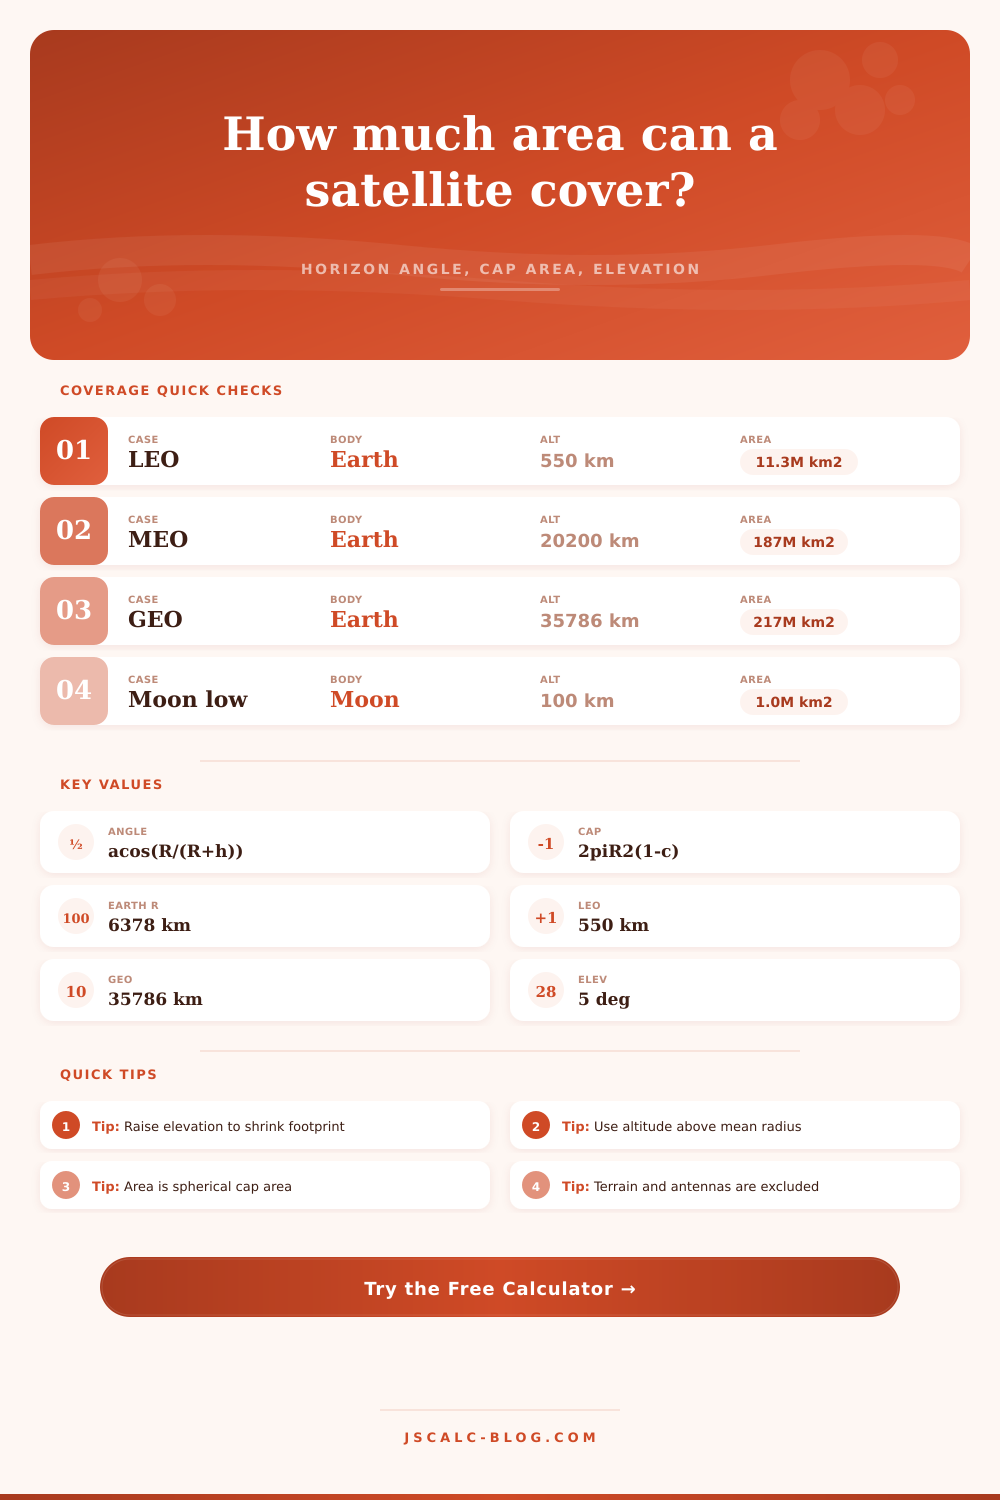
| Satellite case | Body | Altitude | Horizon angle | Cap area |
|---|---|---|---|---|
| ISS-like low Earth orbit | Earth | 420 km | 20.2 deg | 8.76 million km^2 |
| LEO communications shell | Earth | 550 km | 23.0 deg | 11.26 million km^2 |
| Polar imaging orbit | Earth | 700 km | 25.7 deg | 14.17 million km^2 |
| Broadband LEO shell | Earth | 1200 km | 32.7 deg | 24.00 million km^2 |
| GPS-like MEO | Earth | 20200 km | 76.1 deg | 193.70 million km^2 |
| Geostationary orbit | Earth | 35786 km | 81.3 deg | 216.40 million km^2 |
| Low lunar orbiter | Moon | 100 km | 18.9 deg | 1.02 million km^2 |
| Mars relay orbit | Mars | 400 km | 26.5 deg | 4.89 million km^2 |
If you’re reading this, odds are that you’re at a coffee shop, probably on your phone, and enjoying a good connection. Chances are you haven’t thought about all those satellites hanging overhead. As you move around, they hand off packets of data. The whole thing works because we don’t see it.
But to build those networks takes some careful geometry. How far can one satellite see across the curved surface of our planet? Before you launch all that pricey equipment, you’ve got to figure out the answer. That’s where this calculator comes in. It spits out math to make orbital altitude into something real: the area visible from the surface. No astrodynamics degree required.
Why Satellite Coverage Matters
This is the basic idea, and it’s easy to understand yet difficult to execute. Here’s why. A satellite doesn’t view entire globe. It views a spherical cap. Picture yourself holding a basketball in front of your face several feet away and turning on a flashlight. Your coverage area is the bright area illuminated by light. Now raise the light up. You have increased your coverage area. However, as you go farther out, the edge fades into darkness. This is like horizon for satellites.
The tool determines this distance (called the central angle) to the horizon line. It provides the distance from sub-satellite point to the rim of observable disk (arc distance). This arc distance is your footprint radius. Why does this matter? This tells us the maximum distance between ground station and the satellite. If the station move too far away, the satellite will drop below horizon and dissapears.
The elevation mask is a little-known but important practical fact. “You don’t want your signal grazing the horizon as it talks to the satellite. There’s too much atmosphere for signal to pass through. Low-angle links are blocked by terrain obstacles, rain fades and building interference. To prevent this, engineers enforce a minimum elevation angle. Often they go to five or ten degrees. This cuts off outer rim on the geometric horizon.
The calculator take this into account. It reduces the cap area accordingly to represent only usable portion of sky. It’s just a few degrees less, a tweak in terms of degrees. But that translates into a big decrease in coverage area. That’s what happens when you sacrifice area covered for improved link quality.
Scroll through the presets and you’ll start to get an idea how large a footprint various orbits have. Five-hundred-fifty kilometers above earth is considered low Earth orbit. Satellites there has relatively small footprints. They have footprint of a few million square kilometers each. Seems like a lot, right? But the Earth’s big. It would of take dozens or hundreds of such satellites to form some sort of continuous shell.
Much farther up, at something like thirty-six thousand kilometers, are geostationary satellites. These things sees nearly a third of the planet at any given time. Their footprints are massive. And yet because they’re so far away their latency is a problem. Delay causes real-time applications to suffer. The chart on the page spells all this out nicely for reference.
As altitude increases, you can see just how much their area jump. But the returns don’t equal doubling their altitude. They don’t gain twice the coverage. The geometry flattens out. How high do you put things? That’s up to how much you want to cover and what kind of latency you’re willing to accept. For mobile coverage across most of the globe, that means lots of satellites in low Earth orbit. To beam down to one continent, maybe geostationary would work.
You can play with body radius as well in the calculator. Handy when you’re doing a moonshot…or an actual shot at the moon. It’s a small world. So a low orbit takes up less area in absolutes. But it covers more in fractions. Same math, different scale.
A few quick notes on constellation planning: there’s a widespread misconception that with ten satellites you get ten times better coverage than one. Except, people ignore overlap. To make a seamless handoff from satellite to satellite, you need overlap at the edges of their footprints. Without overlap, there is gaps. This multiplier also exists as a simple number in the tool. However, this is an optimistic estimate. In reality, you need complex orbital placement to handle these handoffs.
It is a small thing, but it is important. Usually where the difference lies between a theoretical coverage map and a real network is in those overlap areas. In the end, a constellation must be practical while maintaining as much visibility as possible. How low can you go? As long as you get sufficient area. Can you afford it? What’s the highest elevation mask you can live with while maintaining acceptable data rates?
This is where the calculator comes in. It tells you basic geometry. It shows you raw potential of each orbit. Then you must consider user density, weather, and antenna. But it all begins with that spherical cap. Know your cap and you know your network. You’re just shining a light on the world. It happens one footprint at a time.