Sample Size Power Calculator
Find how many subjects a hypothesis test needs to detect a real effect. Enter the effect size, significance level alpha, and desired statistical power, and this power analysis returns the sample size per group and total N using the z-based approximation.
🎯Power Analysis Presets
📝Study Design Inputs
Used when means test with direct d. 0.2 small, 0.5 medium, 0.8 large.
Used for the two proportions test. Enter a value between 0 and 1.
1 means equal groups. 2 means group 2 is twice as large.
Inflates the enrolled total so completers still meet target N.
🔢Formula Snapshot
📏Cohen's d Effect-Size Benchmarks
| Label | Cohen's d | Overlap | Meaning | Example Context |
|---|---|---|---|---|
| Trivial | 0.10 | ~92% | Barely detectable | Huge n needed to see it |
| Small | 0.20 | ~85% | Real but subtle | Typical psychology finding |
| Medium | 0.50 | ~67% | Visible to the eye | Noticeable group gap |
| Large | 0.80 | ~53% | Obvious difference | Strong treatment response |
| Very large | 1.20 | ~38% | Groups barely overlap | Dramatic, rare effect |
📈Sample Size by Effect Size & Power
| Cohen's d | Power 0.70 | Power 0.80 | Power 0.90 | Power 0.95 |
|---|---|---|---|---|
| Values are per group for a two-sample two-tailed test at the alpha you selected. | ||||
Table recomputes with your alpha and tails. Cells show sample size per group for a two-sample means test.
📐Critical z-Values for Alpha & Power
| Setting | One-Tailed z | Two-Tailed z | Power | z_beta |
|---|---|---|---|---|
| alpha 0.10 | 1.2816 | 1.6449 | 0.70 | 0.5244 |
| alpha 0.05 | 1.6449 | 1.9600 | 0.80 | 0.8416 |
| alpha 0.025 | 1.9600 | 2.2414 | 0.85 | 1.0364 |
| alpha 0.01 | 2.3263 | 2.5758 | 0.90 | 1.2816 |
| alpha 0.001 | 3.0902 | 3.2905 | 0.95 | 1.6449 |
🗂Design Comparison Grid
| Scenario | Test | Effect | Alpha | Power | n / Group |
|---|---|---|---|---|---|
| Comparison sizes appear after calculation. | |||||
Each row is computed live so you can weigh how design choices move the required sample size.
⚙Full Formula Breakdown
📋Power Analysis Reference Values
| Input | Common Choice | How It Is Used | Effect on Sample Size |
|---|---|---|---|
| Effect size d | 0.2 to 0.8 | Sits in the denominator as d² | Smaller d raises n sharply |
| Alpha | 0.05 or 0.01 | Sets z_alpha critical value | Stricter alpha raises n |
| Power | 0.80 or 0.90 | Sets z_beta critical value | Higher power raises n |
| Tails | Two-tailed | Splits alpha into both tails | Two-tailed needs more than one |
| Allocation ratio | 1:1 | Rebalances the two arms | Unequal groups raise total N |
| Dropout | 10% to 20% | Inflates the enrolled count | Higher dropout raises enrollment |
💡Practical Power Analysis Tips
Your goal is to plan a study and wonder about its validity. It is not merely about collecting data, but about whether you’ll have enough when you analyze your findings to draw any conclusion. Doing an underpowered study harms science’s reputation. It cost money without contributing to the result; it gives researcher inconclusive answers.
How many people should you invite to participate? Before you send your first email out, you want a solid number to shoot for. Something beyond guesswork or gut feeling. Enter power analysis: This mathematical tool calculate how many people to recruit so you’ll have a good shot at achieving meaningful results.
How to Find the Right Number of People for Your Study
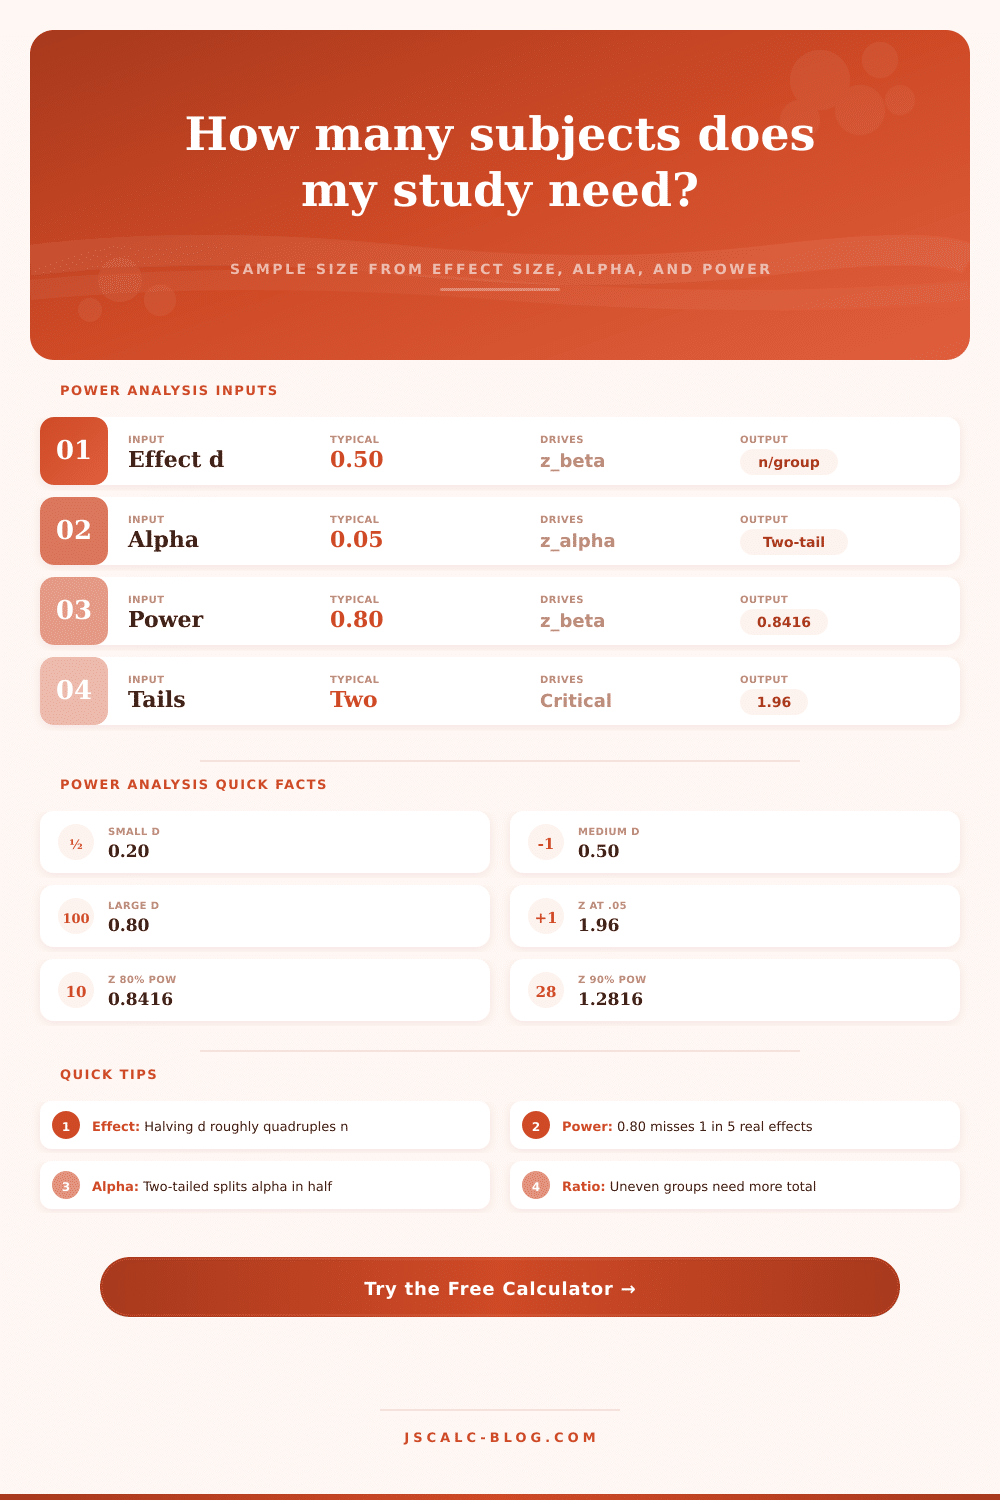
After you learn the lingo, it’s easy to grasp core inputs. The first is effect size, the type and size of real-world impact you anticipate seeing from your treatment. Are you evaluating a drug with dramatic effects? Or is it a slight nudge that doesn’t move the needle much at all? This expected effect can be expressed as a number called Cohen’s d (pronounced co-hen’s d). In general, a Cohen’s d of 0.5 is regarded as a medium difference. It’s a noticeable gap between group results.
To get below that requires a smaller effect (say, 0.2) and that will require a larger study (meaning more money), as you’ll see next. Roughly halving your anticipated effect size roughly quadruples your sample size. That’s the trade-off to get greater accuracy.
Finally, there’s power and alpha. Power is your protection from failing to detect something real (a “safety net”). If you set your power at 80%, then you have an 80% chance of detecting the true difference should it exist. That means that one-in-five times you’ll be wrong: you’ll conclude that there’s no difference when in fact there was. In clinical trials, the stakes are high and the miss-rate seem unacceptably high. Many researchers insist on having power at the ninety percent level.
Alpha is your risk of calling something a finding when, in fact, it isn’t. Your standard is typically zero point zero five. Plug these numbers into the calculator, and it do the math for you. No need to fiddle around with those pesky normal distribution tables yourself. But that’s the beauty of it: it’s a straightforward number, but it packs a punch. This number represent exactly how many people need to complete your study.
And by “how many,” we generally mean “recruit how many people to actualy show up,” as opposed to merely “signing up.” If you anticipate some people dropping out before completion, increase your recruitment estimates to accommodate this loss. Otherwise, you risk turning a well-designed study into an underpowered mess. With a single click, you can enter in the projected dropout rate and adjust the bottom-line number based off reality instead of a best-case scenario.
Determining sample size is usually considered a bureaucratic hassle. Most choose some number based on their budget constraints and then hope it’s sufficient. This approach increase the chance of errors and bias. Conducting proper power analysis makes you face the feasibility of your own hypothesis at an earlier stage. You require five thousand participants to detect a small effect, but you has a budget for only fifty. You’re now facing a design issue. One that can’t be solved through math alone.
Accepting lower power or adjusting your alpha may seem like shortcuts, but they come at the cost of the integrity of your findings. The accompanying reference table also provide visualizations of these tradeoffs. It demonstrates why higher standards mean more data. But most of all, it’s about respect. It is for both the subjects and for the science.
Too few subject means their participation lacks significance. Too many mean exposure to unnecessary cost or risk. Balancing these two things (statistical rigor and practicality) is a skill that can’t be automated, though the calculator helps by giving you the precision. Then it’s up to you. Based on your judgment; as to whether this study is even worth undertaking.
Use a realistic effect size. Admit what you have in terms of resourses. Run the numbers before committing to your initial subject.