Salvage Value Calculator
Estimate an asset's salvage value by policy percentage, accumulated depreciation, or market decline, then compare book value, resale value, and depreciable base.
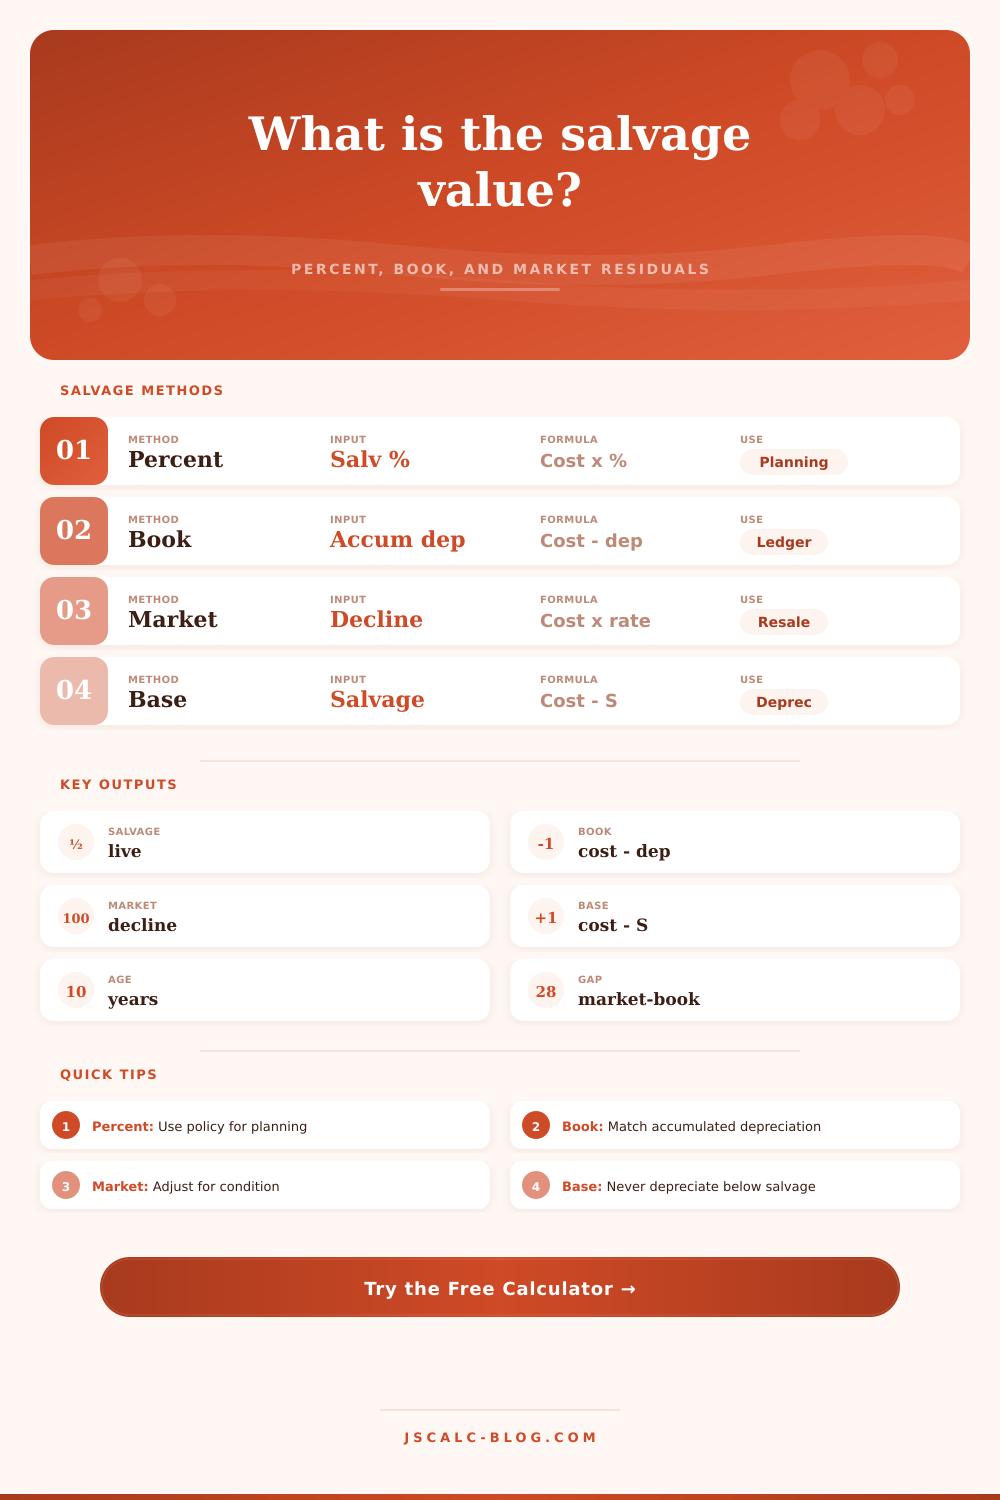
These are the core formulas used by the calculator. The selected primary method changes the main card, but every method is calculated side by side.
| Output | Formula | Best input source | What it tells you |
|---|---|---|---|
| Salvage value from percentage | Original cost x salvage % | Policy, tax schedule, appraisal rule | Expected terminal value for planning depreciation. |
| Residual value after depreciation | Cost - accumulated depreciation | Fixed asset register or ledger | Current book value before disposal assumptions. |
| Market residual using decline | Cost x (1 - decline rate)^years | Used-market trend or appraisal | Estimated resale value before condition adjustments. |
| Depreciation base | Cost - salvage | Chosen salvage estimate | Maximum depreciable amount over the asset life. |
| Profile | Typical salvage % | Annual decline | Useful life | Common caution |
|---|---|---|---|---|
| Vehicle or fleet asset | 12% to 25% | 12% to 22% | 5 to 8 years | Mileage and accident history can dominate age. |
| Computer or technology | 3% to 12% | 22% to 40% | 3 to 5 years | Security, battery, and support status affect resale. |
| Machinery or production equipment | 8% to 22% | 8% to 18% | 7 to 15 years | Maintenance records can support a higher residual. |
| Furniture or fixtures | 5% to 18% | 10% to 25% | 5 to 10 years | Bulk resale may clear below individual item value. |
| Restaurant or kitchen equipment | 6% to 18% | 12% to 24% | 5 to 10 years | Condition, sanitation, and installation removal matter. |
| Medical or lab equipment | 8% to 25% | 10% to 24% | 5 to 10 years | Calibration and regulatory records affect buyer confidence. |
| Heavy equipment | 18% to 35% | 7% to 16% | 7 to 12 years | Hours, attachments, and maintenance drive residual value. |
| Energy infrastructure | 5% to 20% | 6% to 16% | 8 to 20 years | Warranty transfer and parts availability matter. |
| Scenario | Salvage value | Depreciation base | Book residual | Market residual | Market-book gap |
|---|---|---|---|---|---|
| Calculate to fill the scenario grid. | |||||
| Original cost | 5% salvage | 10% salvage | 20% salvage | 30% salvage |
|---|---|---|---|---|
| $10,000 | $500 | $1,000 | $2,000 | $3,000 |
| $25,000 | $1,250 | $2,500 | $5,000 | $7,500 |
| $50,000 | $2,500 | $5,000 | $10,000 | $15,000 |
| $100,000 | $5,000 | $10,000 | $20,000 | $30,000 |
| $250,000 | $12,500 | $25,000 | $50,000 | $75,000 |
| $500,000 | $25,000 | $50,000 | $100,000 | $150,000 |
When you purchased those office laptops or that sweet new delivery van, you paid attention to the sticker price and monthly payment. You probably didn’t think much about scrap heap when you bought that shiny new delivery van or upgraded the office laptop.
There’s another price tag attached to any purchase. It shows how much a purchase cost over time. That’s what we call the salvage value, what you anticipate receiving when you give the asset the boot.
What is Salvage Value and Why It Matters
This number can skew your depreciation schedules. It can mess up your tax planning. It can get you staring at a loss you never saw coming. So don’t get this one wrong.
This is where the calculator above does all the work. It combines market decline rates, accumulated depreciation and policy percentages in one place.
Salvage value is something most folks considers a fixed figure lifted off textbook table. That’s seldom how life works out in the real world. Having a policy salvage percentage represents a clean planning target. Maybe you plan for a fleet vehicle at fifteen percent. But what do your books tell you?
If accumulated depreciation has already chomped away at asset value, then you’ve got a different story going on. You can compare those worlds side by side with the tool. It reveals where the ledger of your accounts meets the messy world of the resale market.
The distinction between market value vs. Remember that book value is accounting gymnastics. It’s based off your original purchase price minus what you’ve depreciated to date. It is logical and clear, but often completely disconnected from reality.
Market value, on the other hand, is determined by condition, supply, and demand. Maybe you own several computers, two years old, which still have high book value. Why? They’re only two years old. They have a five-year useful life.
In the market for used tech, however, they may be worth half as much. Why? Support cycles and battery degradation has made them less appealing. That’s the space where the decision gets made and money goes to waste.
This reality shows in the tool’s asset presets. A restaurant fryer is not the same than a solar inverter. If the maintenance log on a heavy piece of machinery is perfect, then a construction loader will hold its value very well. Often, it still costs eighteen to thirty-five percent of what it originally did.
On the other hand, tech stuff can fall off a cliff at forty percent per year, during the first few years. These common decline rates comes into play with the calculator. And so you can begin to see the loss of value… quickly.
You can dial up or down for condition penalties or market premiums (local). This adds a level of realism that a single flat percentage cannot capture. This is especially true with condition adjustments. Average-wear condition is one thing. Accident-repaired condition within last 6 months is something else.
Missed your oil change? You can dial that into the interface. That moves the estimated market residual up or down. It makes you consider the actual state of the asset. It is not merely how old it is.
That’s crucial, since depreciation is supposed to reflect the rate at which the asset consumes the benefits of ownership. Poor maintenance means that it has done so at a higher rate then assumed by the schedule.
Disposal costs are a hidden cost of salvaging assets. A common mistake when calculating salvage is to take a guess at what the asset would sell for, then assume that’s the net amount you will recover. That’s incorrect. Any money you have to spend on transport, removal or reconditioning reduces the sales proceeds.
The calculator provides a place where you can reduce the sale price by disposal costs. You’ll compare the reduced number to your original book value. But the number that gets plugged into your bottom line is the net number.
Overlooking this number result in overly optimistic predictions. When the asset is finally gone, you’re left with some extra bills.
Salvage value is your finish line. The finish line represents the end of your investment. You know where the start is (the purchase price). You have an idea of how far away the finish line is, which is the useful life. The challenge is understanding where the finish line is based off your level of maintenance and when you decide to call it quits.
The tool allows you to plot out that endpoint better. What’s the finish line? Where will that be? And what happens if you assume a faster or slower decline rate? How does a modest disposal fee affect the outcome?
When you test different scenarios against the tool, you are able to see that shift in final outcome. Having that insight is priceless. It informs how you treat the asset from day one. You understand that every dollar of neglect or poor planning reduces the final payout.
There’s no complicated equation. Just a recognition that disciplined treatment leads to smart capital allocation vs. It would of blind guessing.